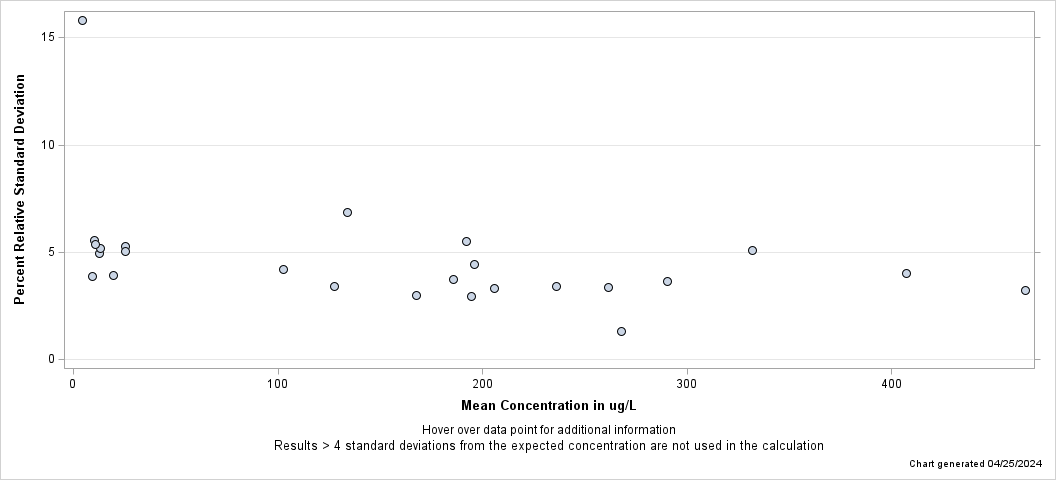
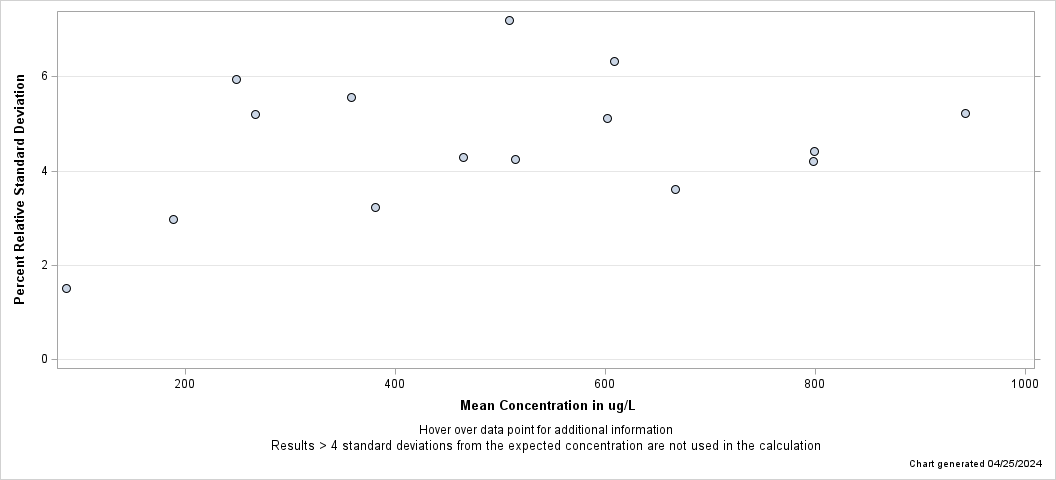
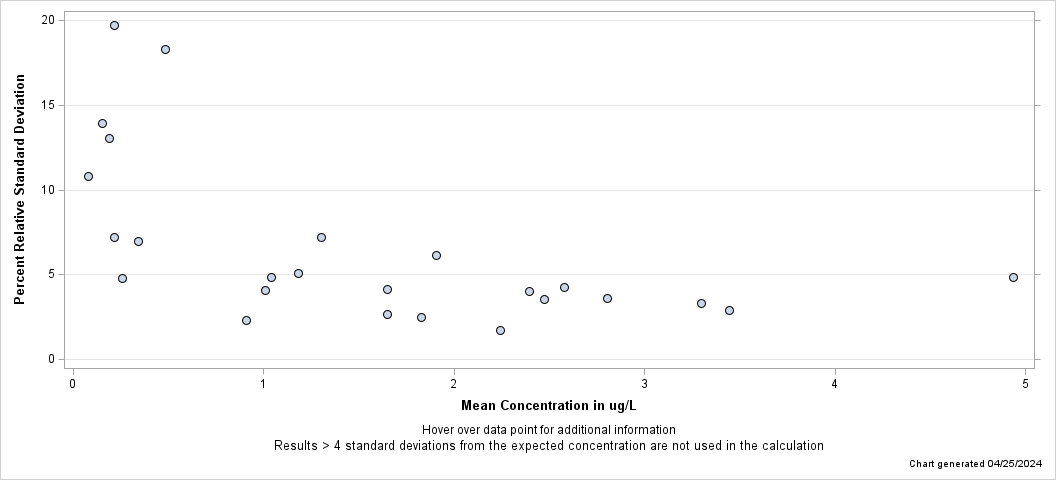
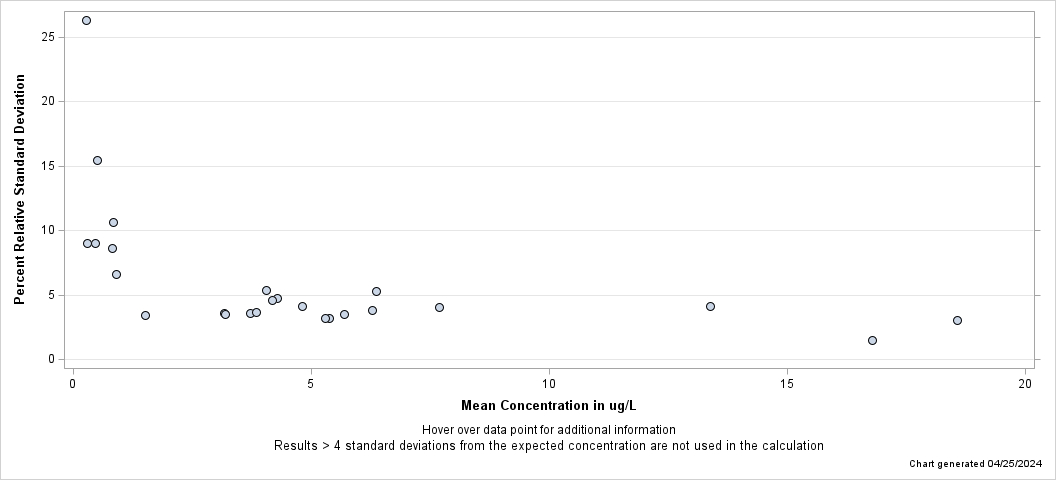
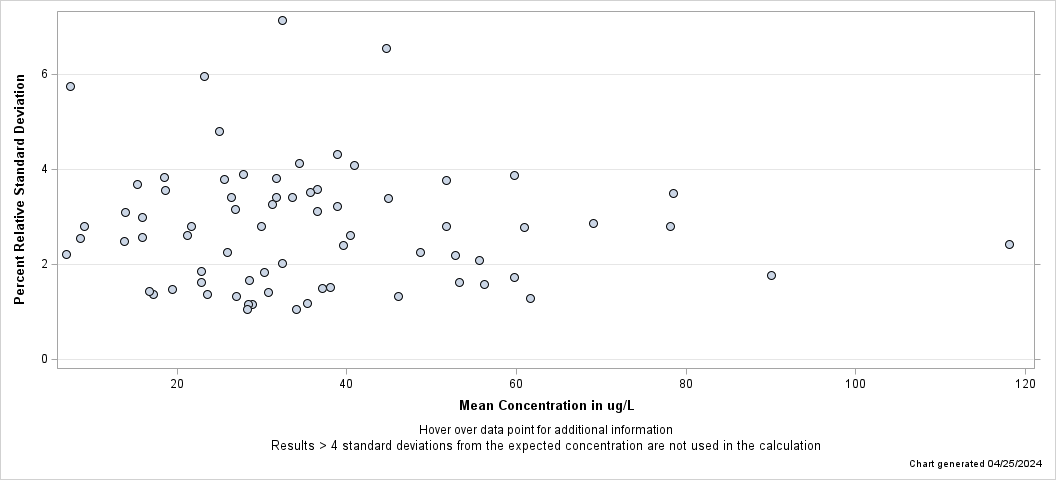
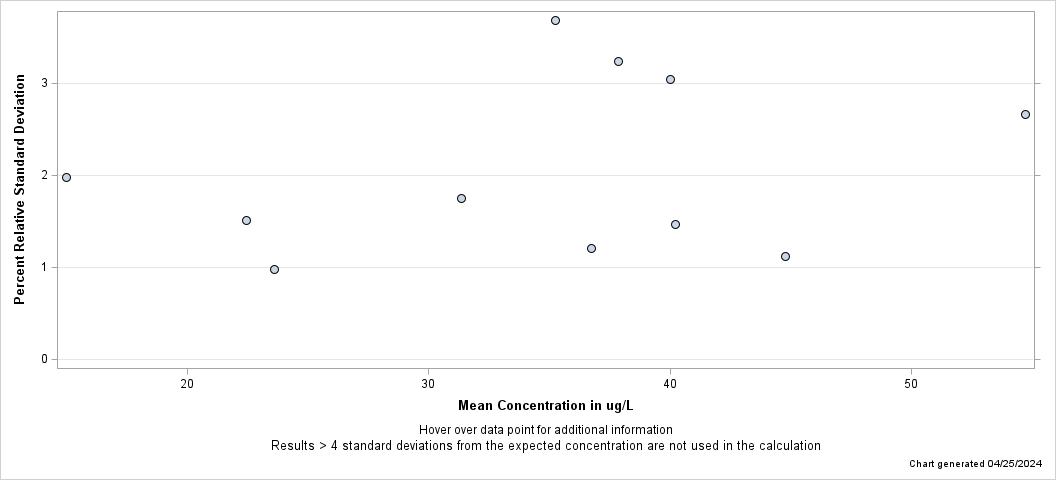
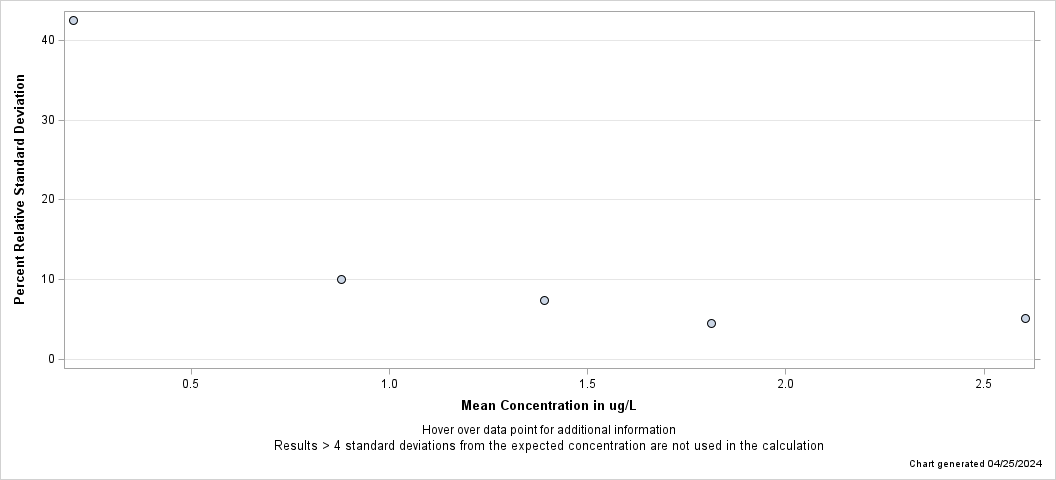
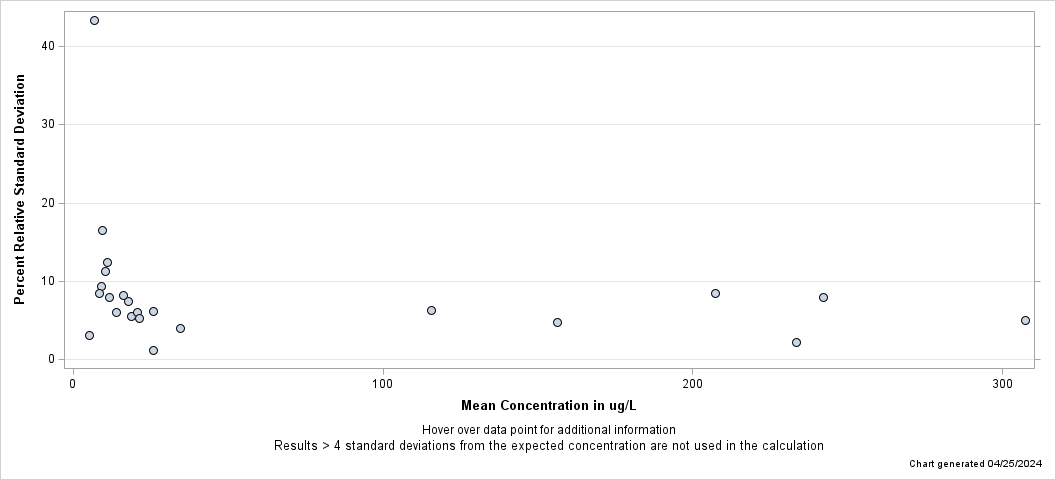
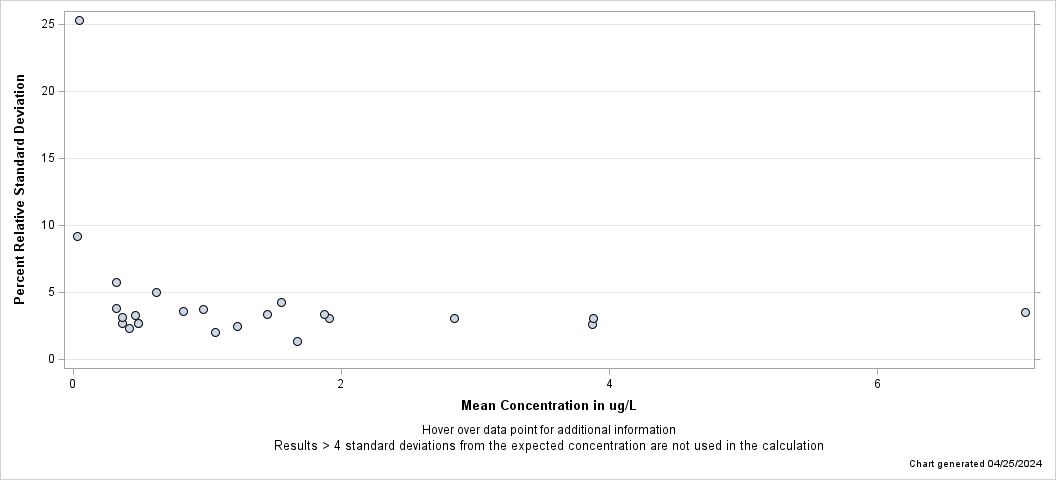
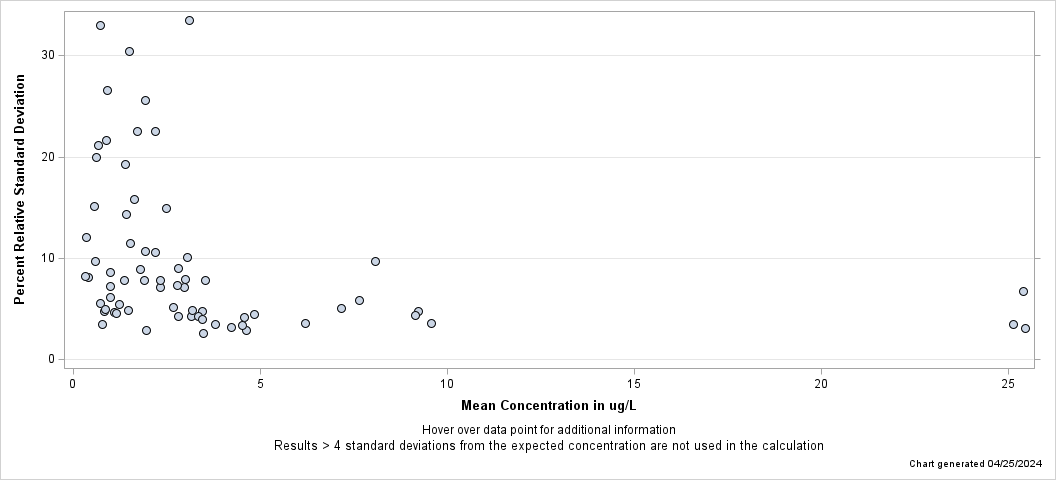
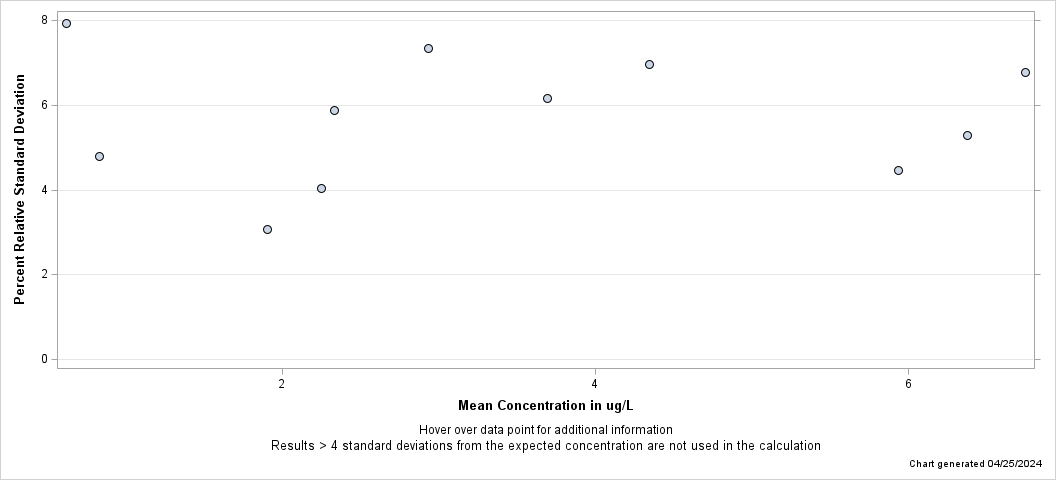
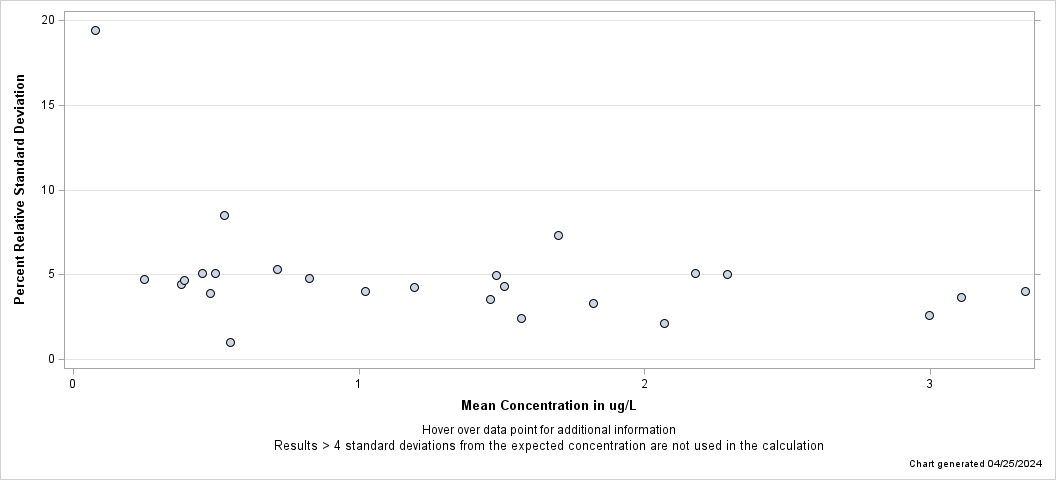
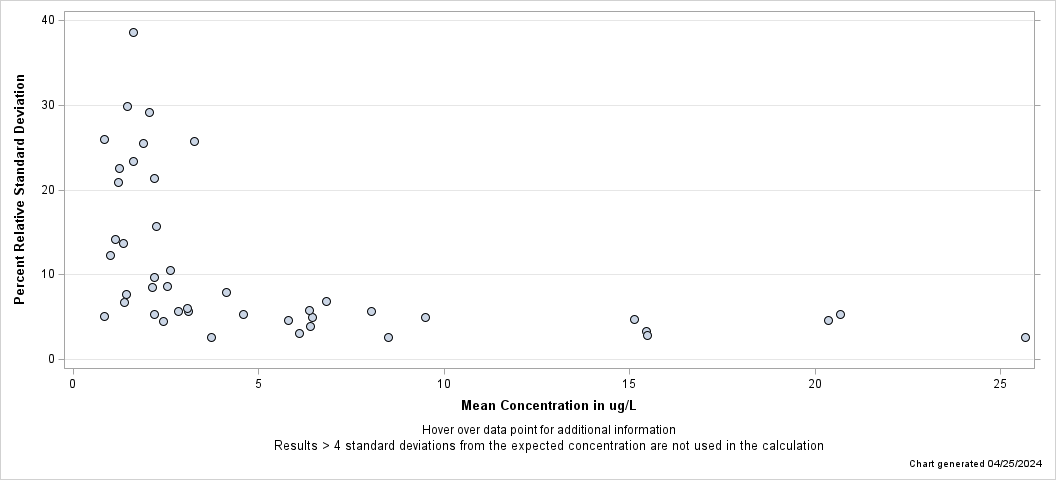
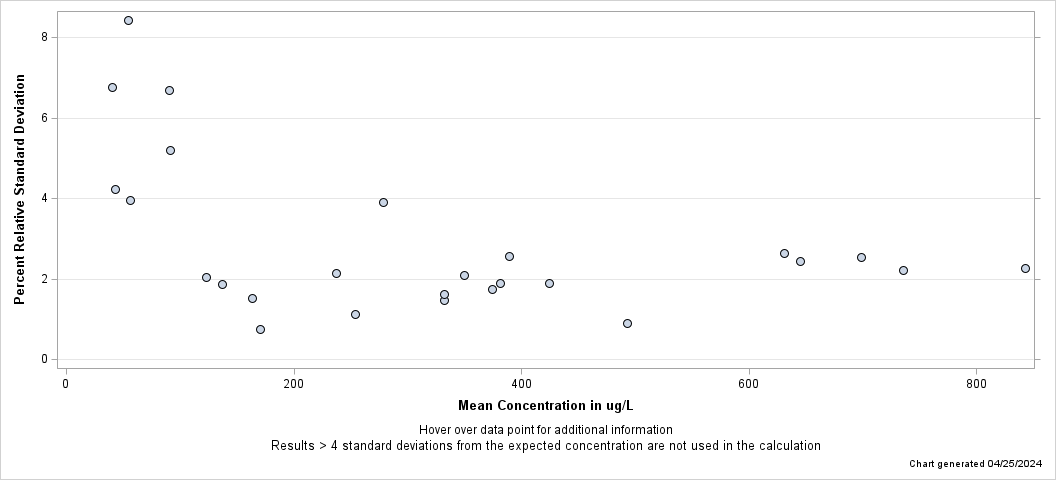
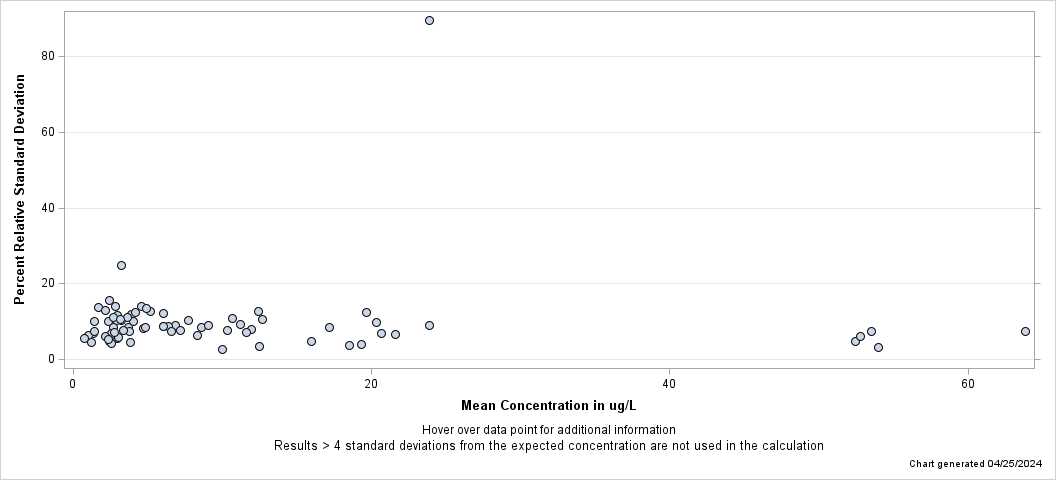
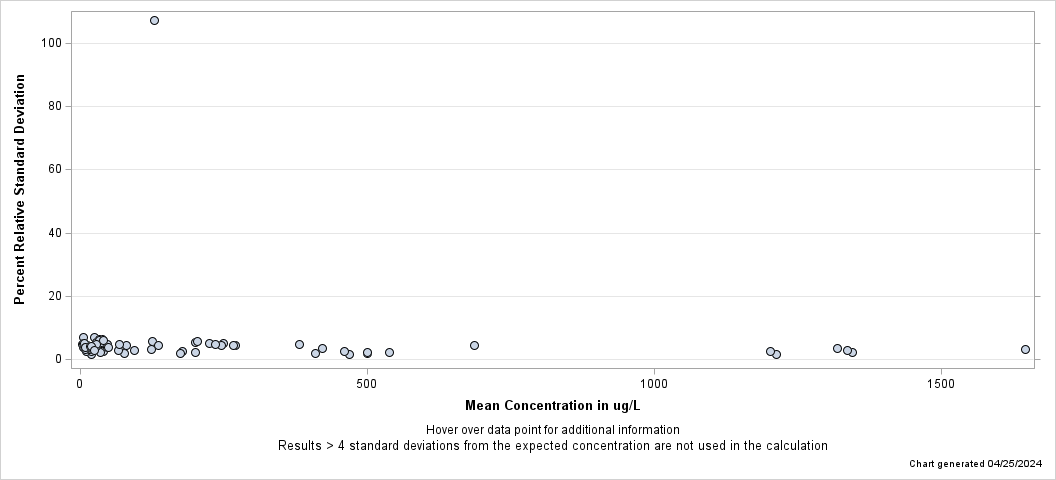
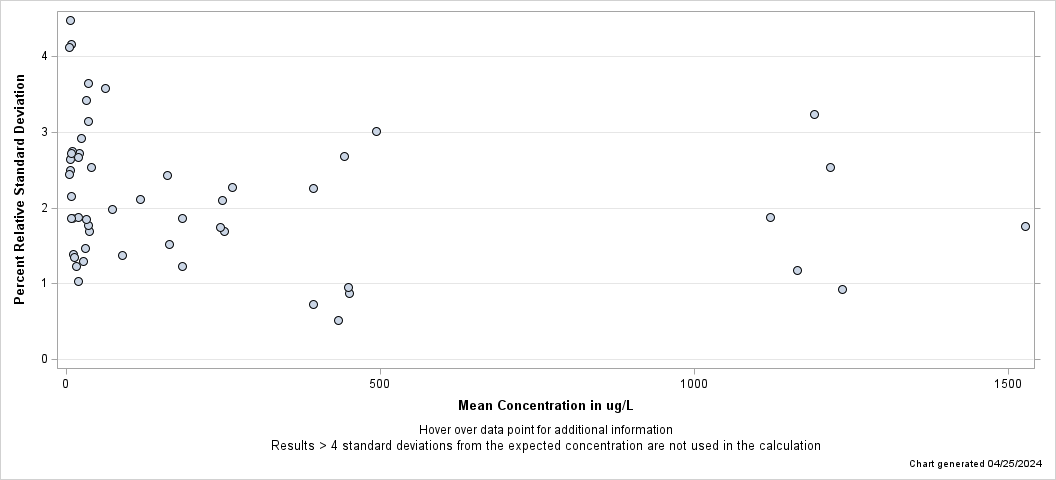
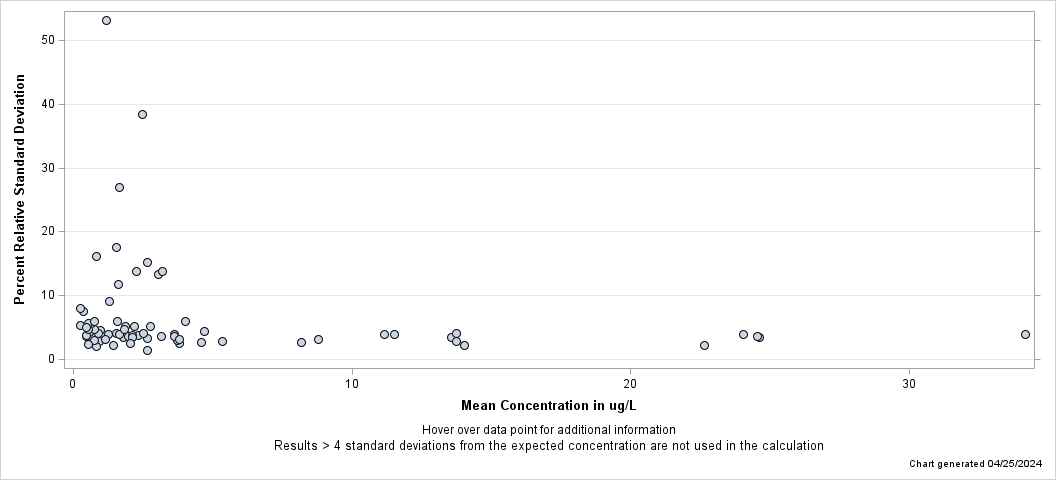
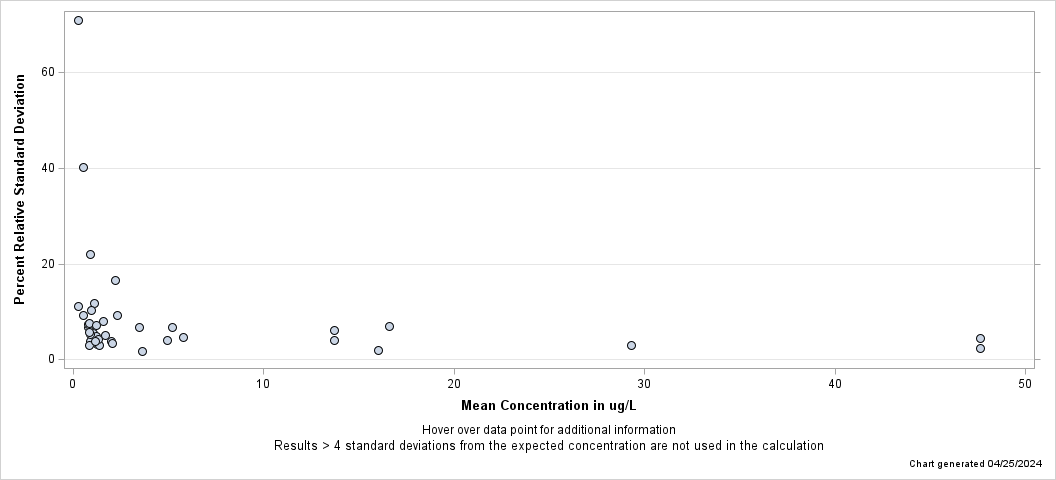
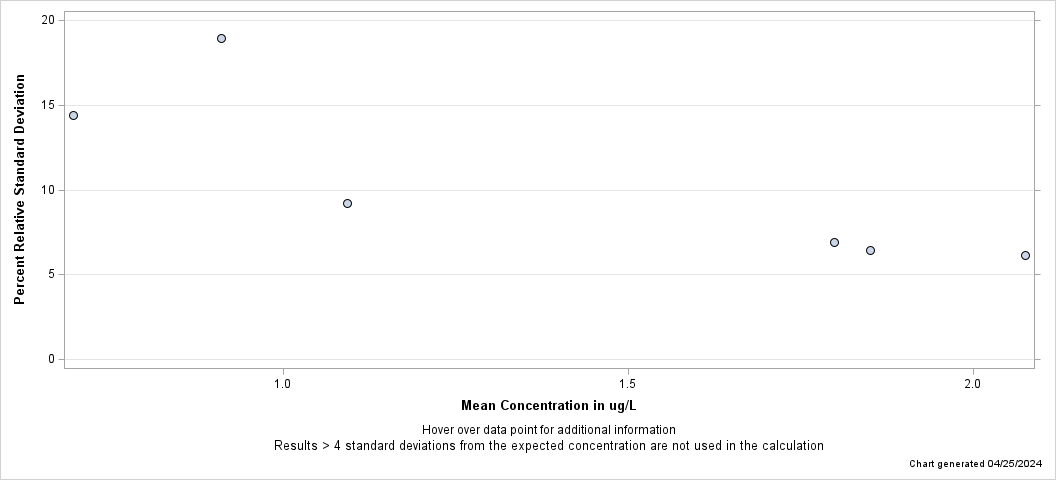
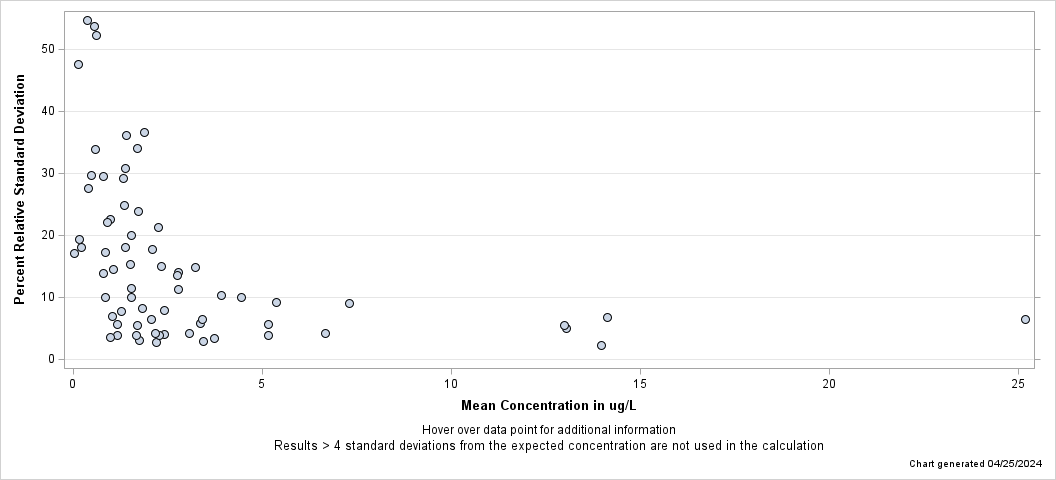
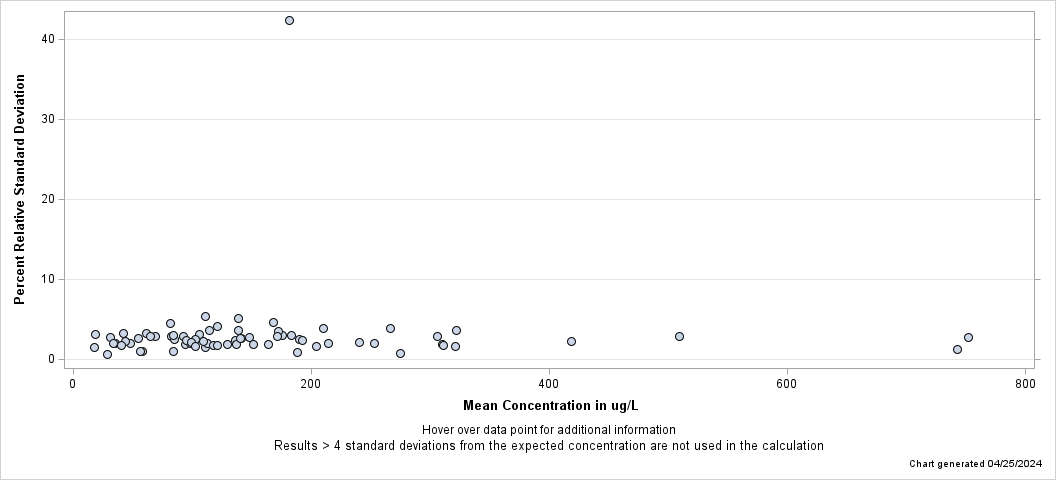
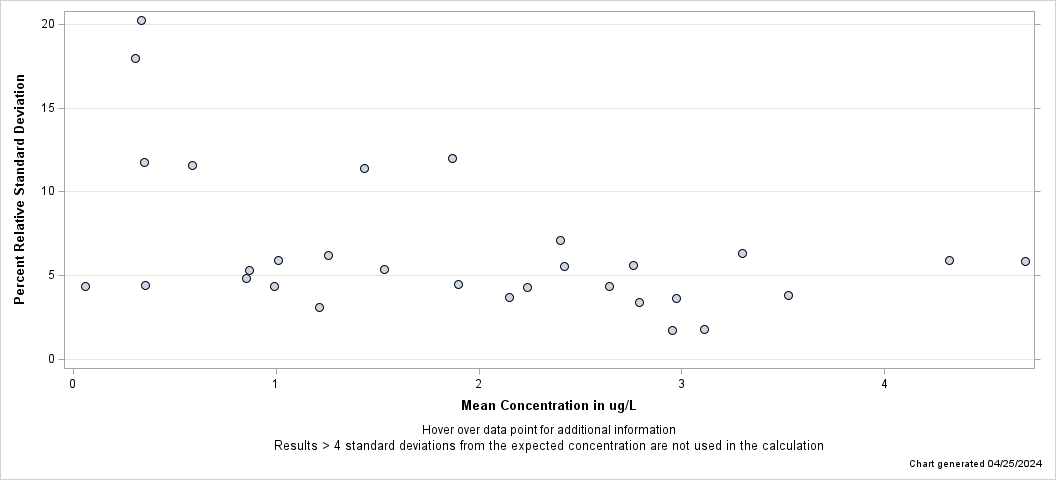
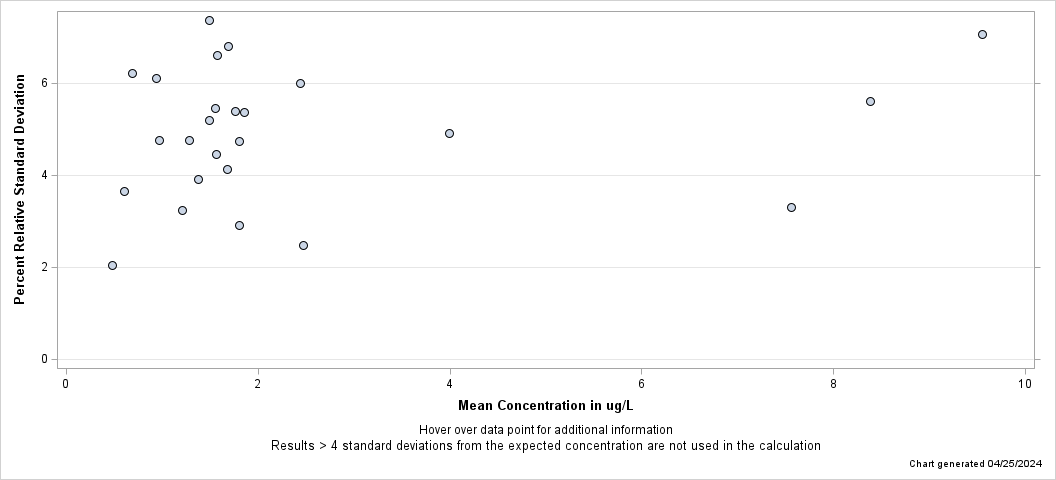
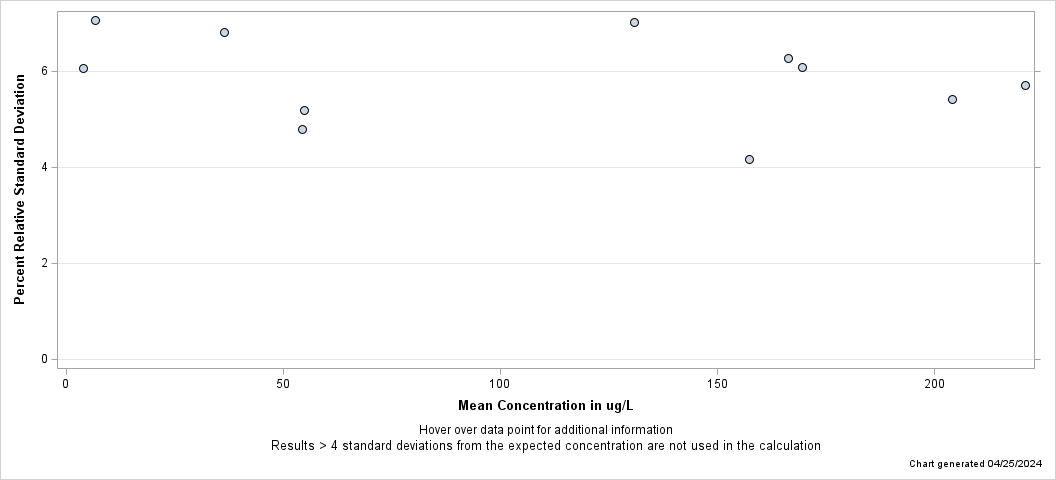
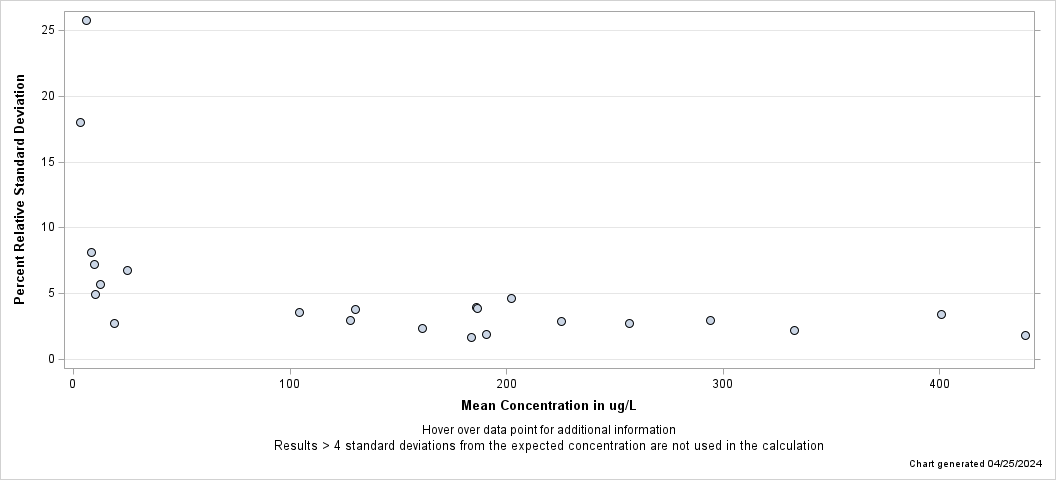
| - Aluminum, fltd, ICP-MS - |
| Percent Relative Standard Deviation |
| Lab: NWQL, PCode: 01106, MCode: PLM10 |
| Dates: 02/08/19 through 04/09/25 |
| Open Data Set |
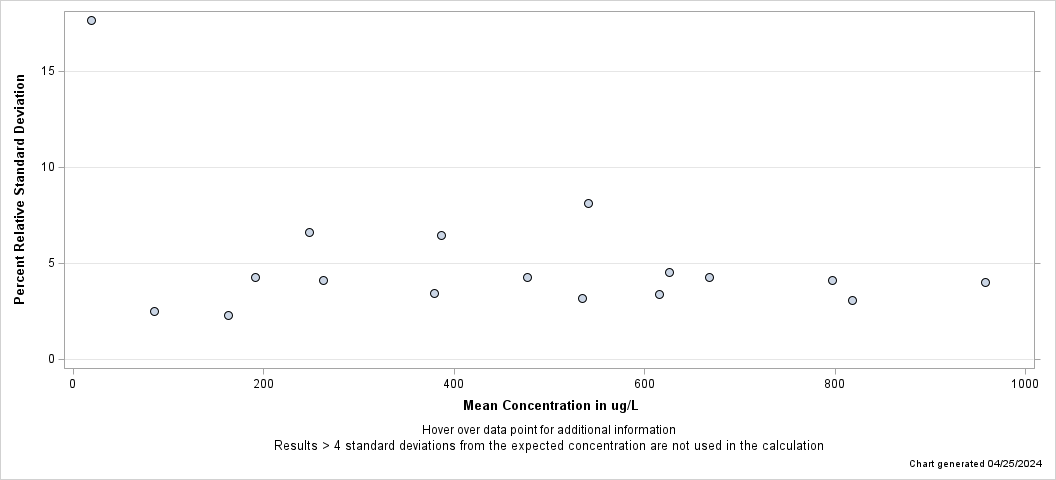
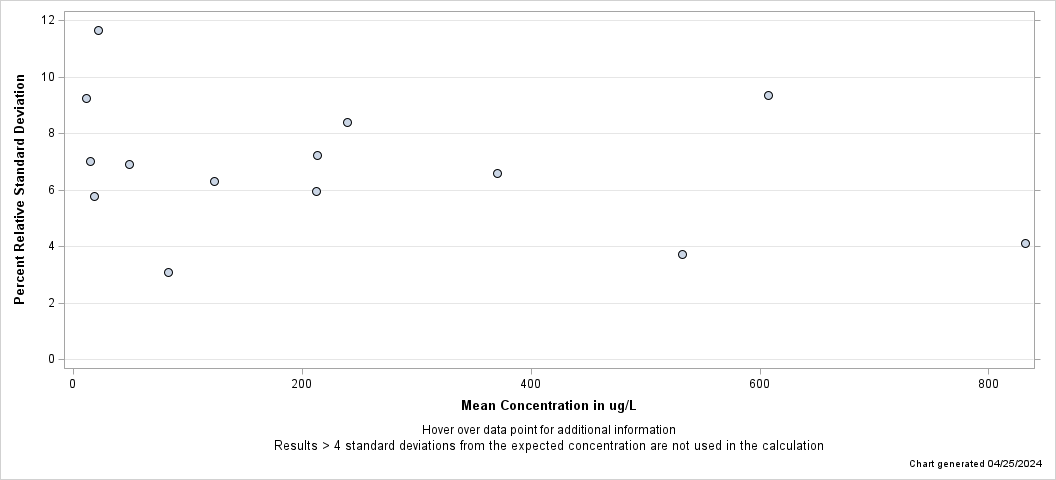
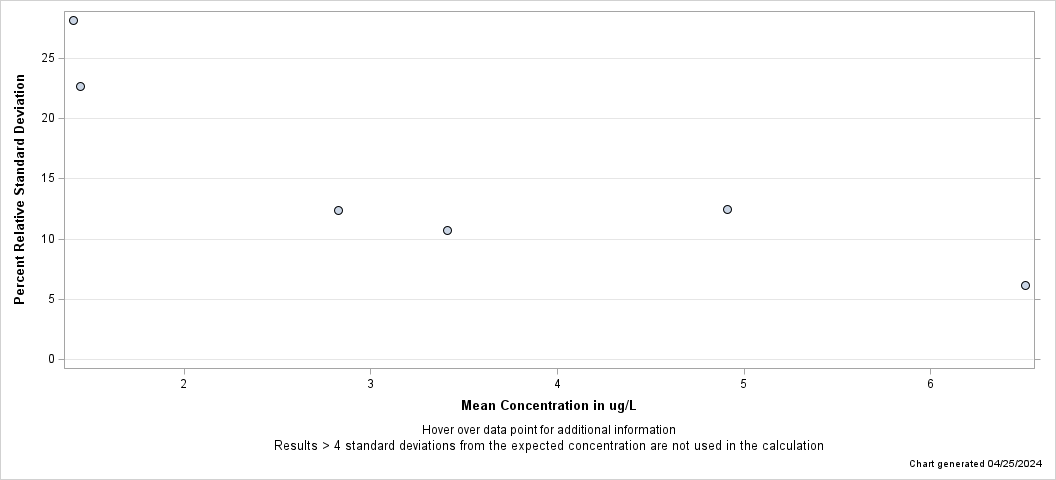
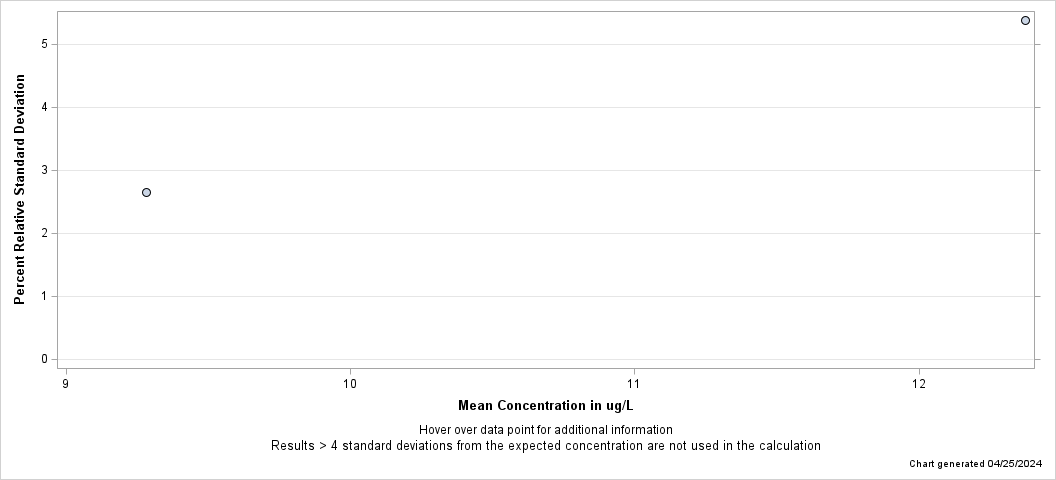
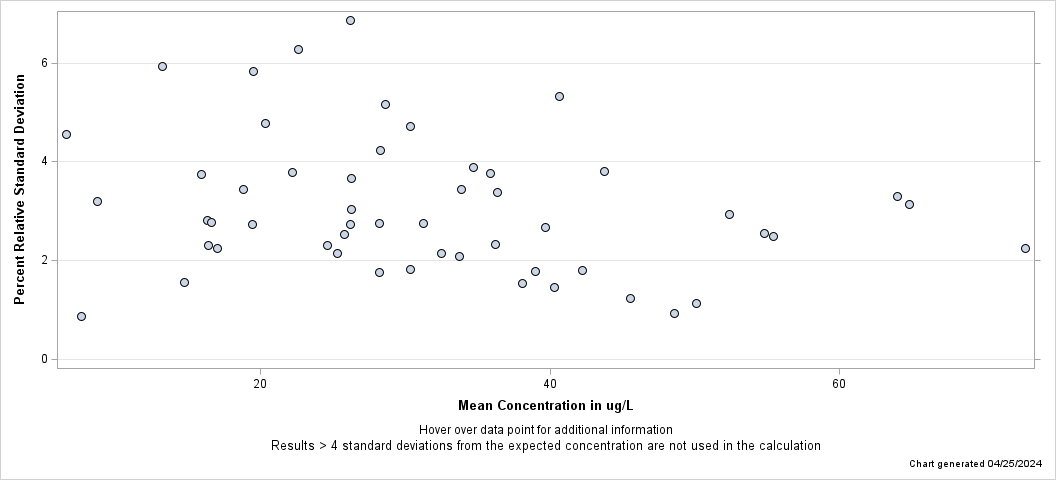
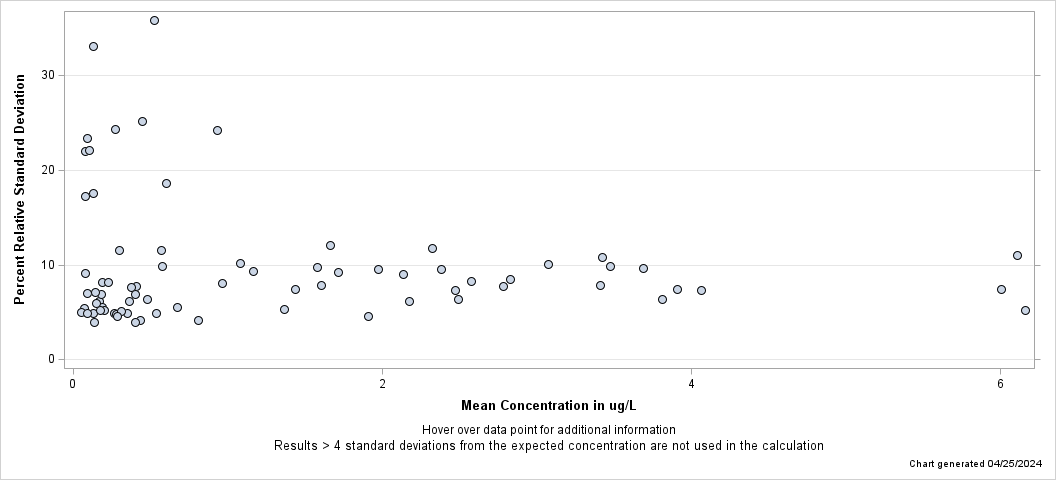
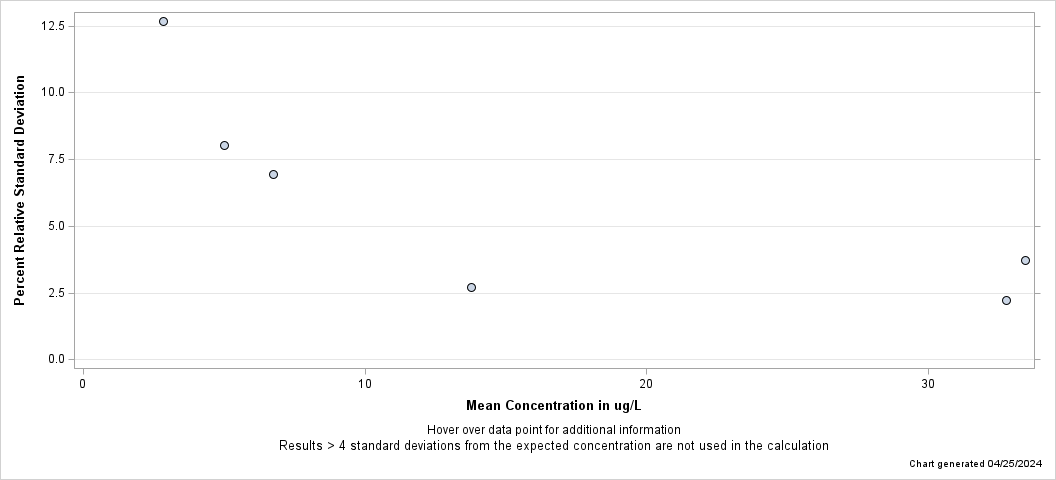
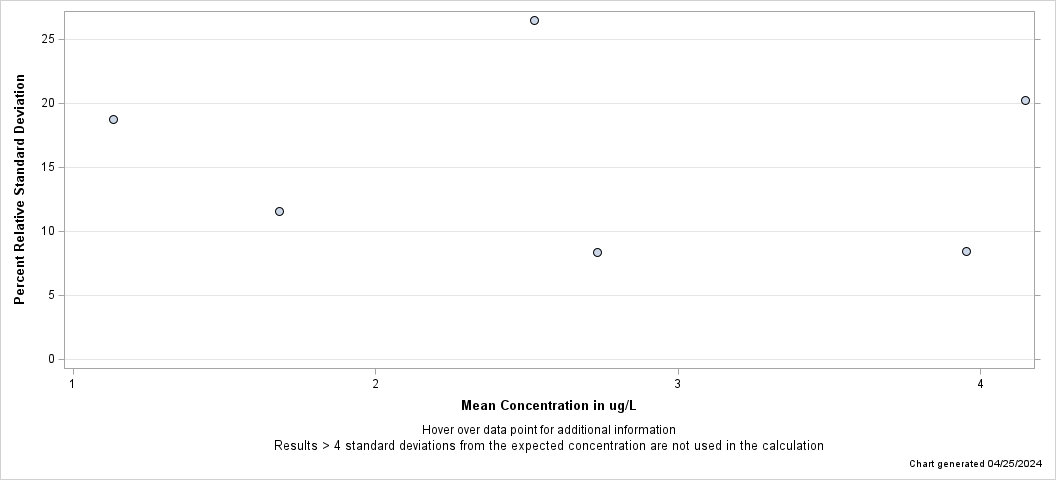
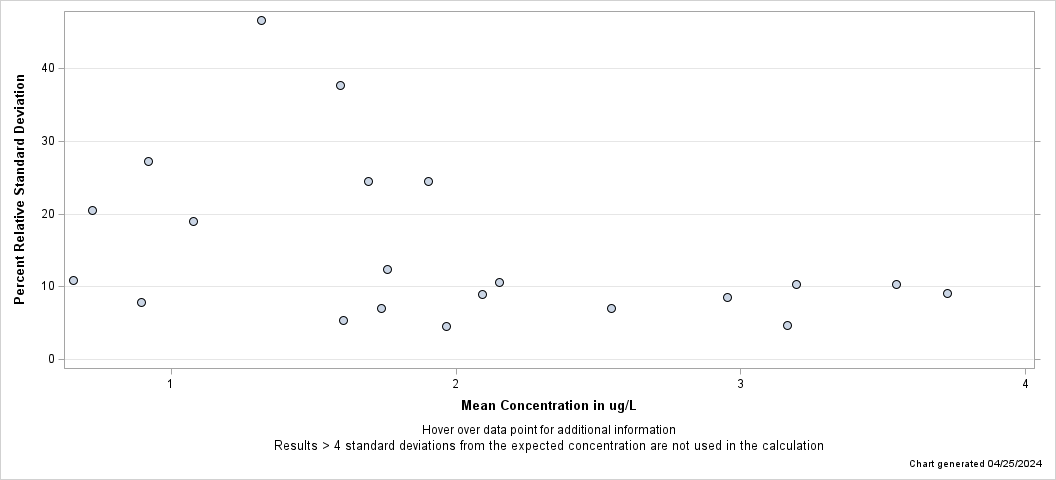
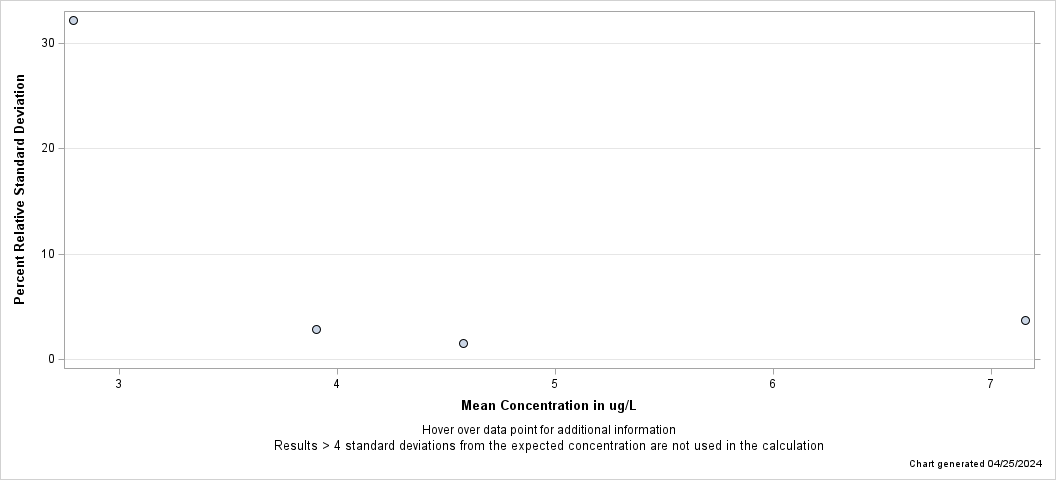
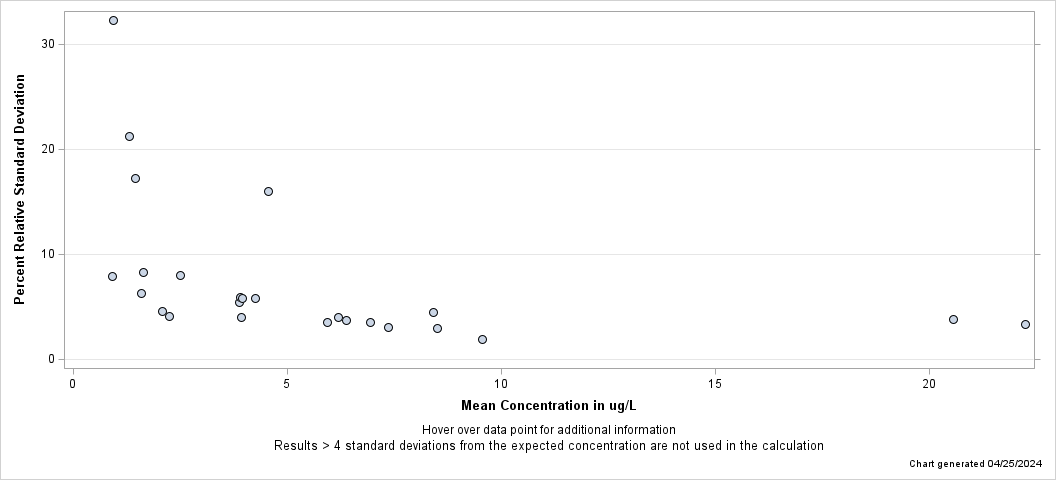
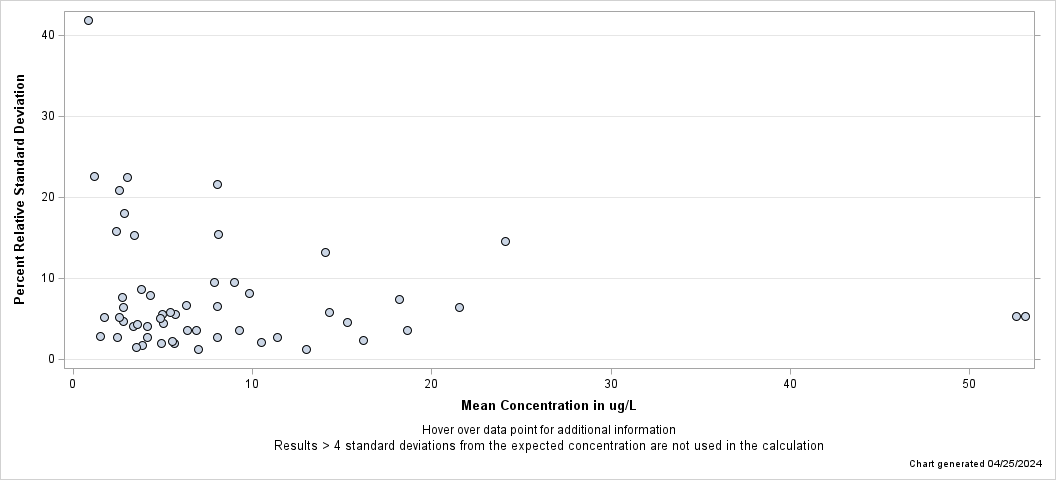
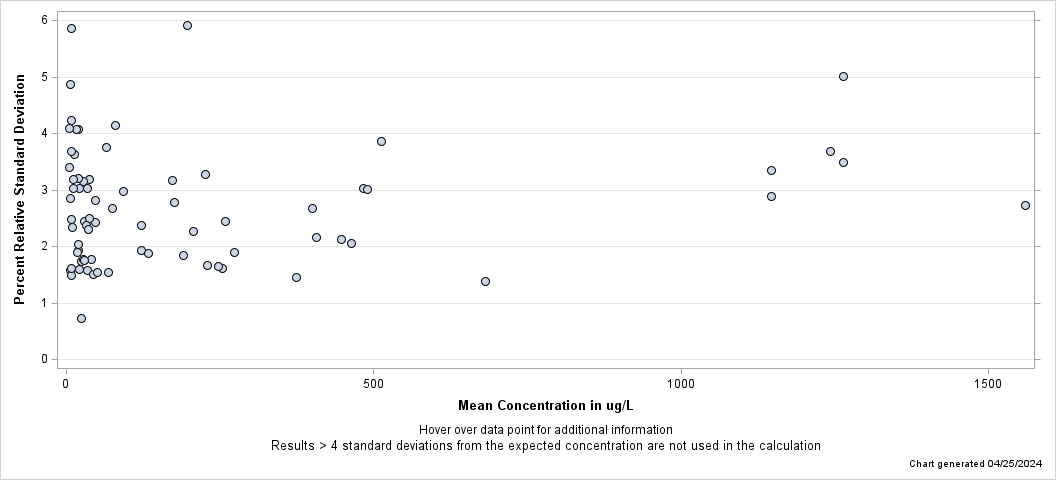
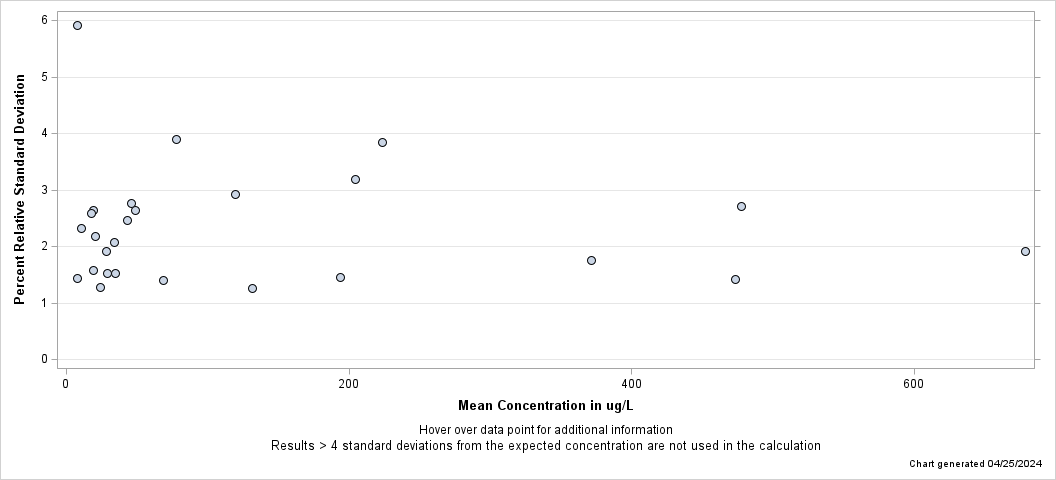
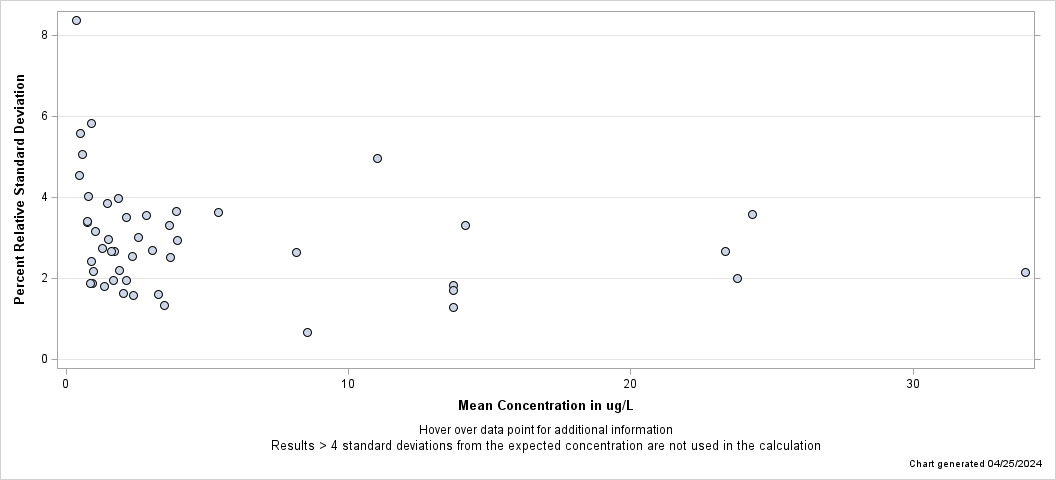
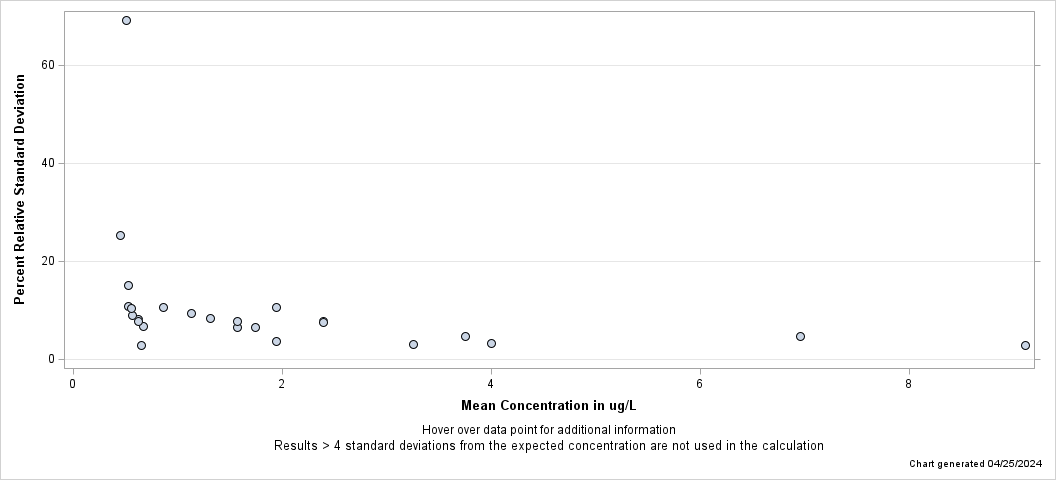
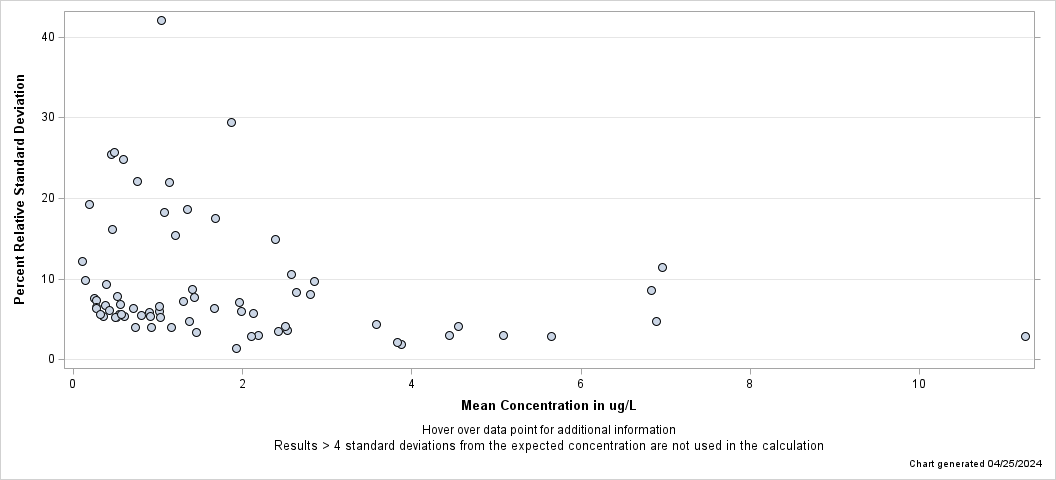
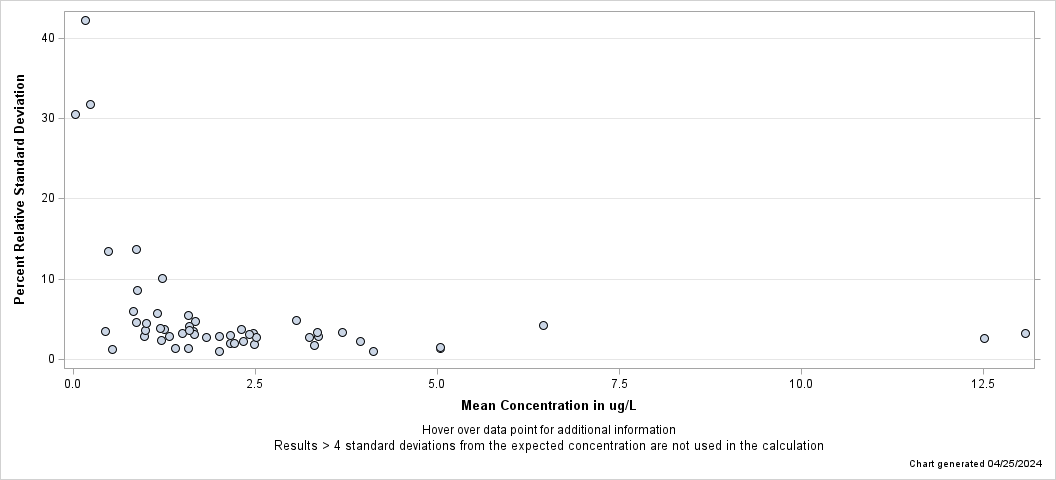
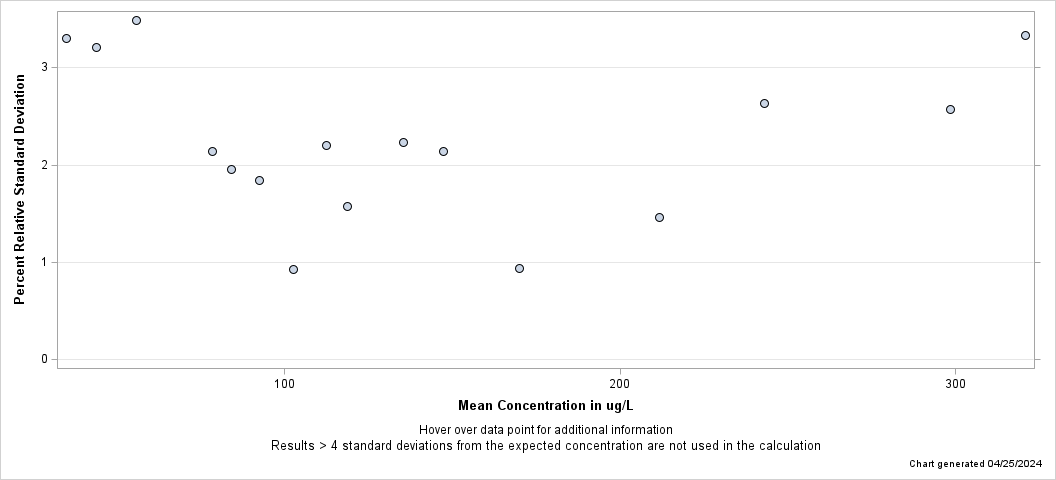
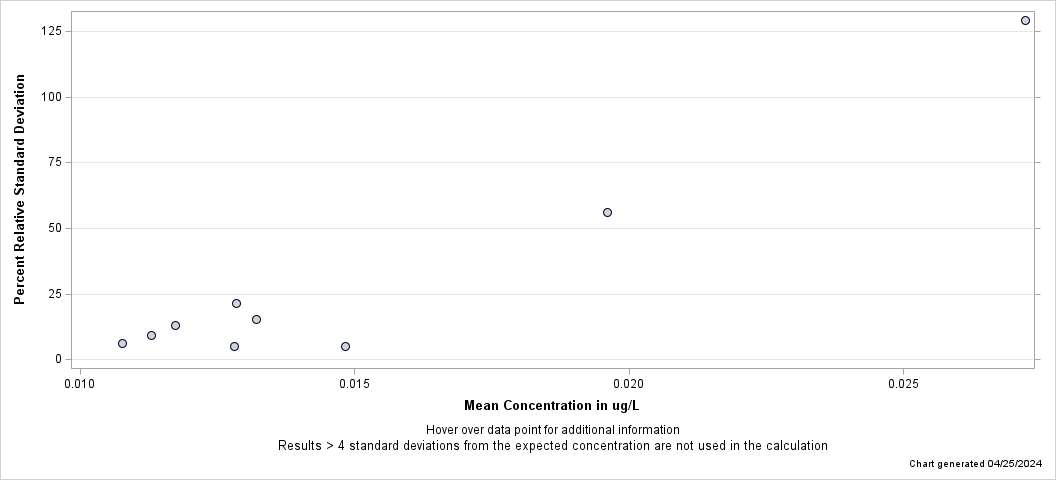
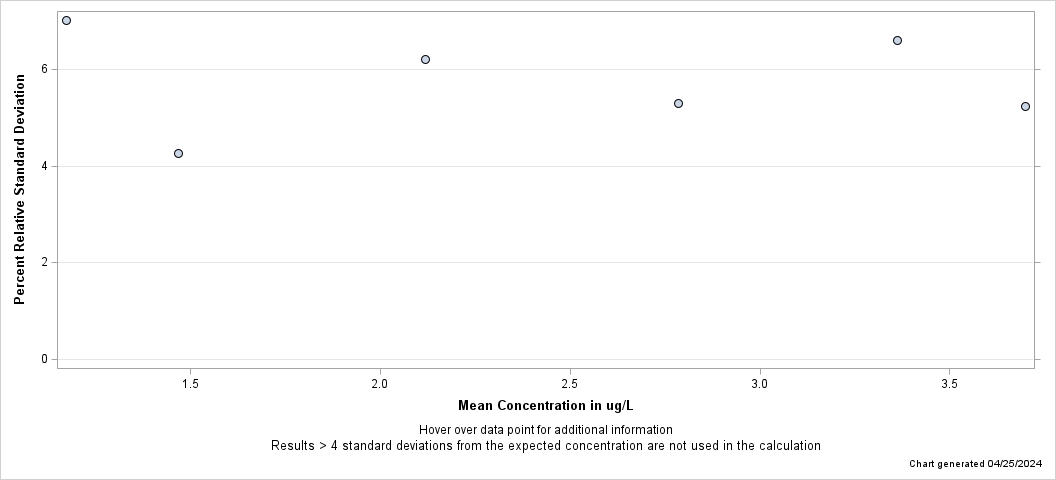
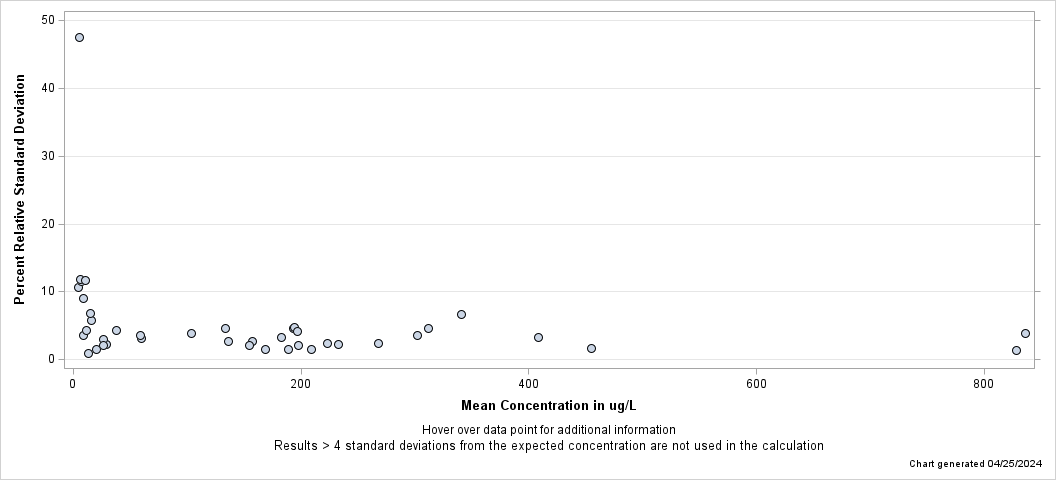
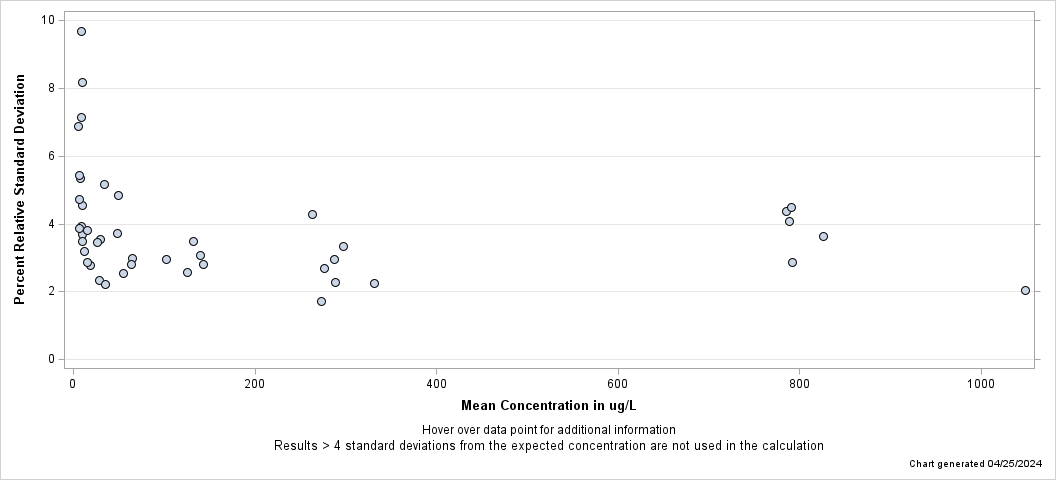
| - Aluminum, fltd, ICP-MS - |
| Percent Relative Standard Deviation |
| Lab: NWQL, PCode: 01106, MCode: PLM10 |
| Dates: 02/08/19 through 04/09/25 |
| Open Data Set |
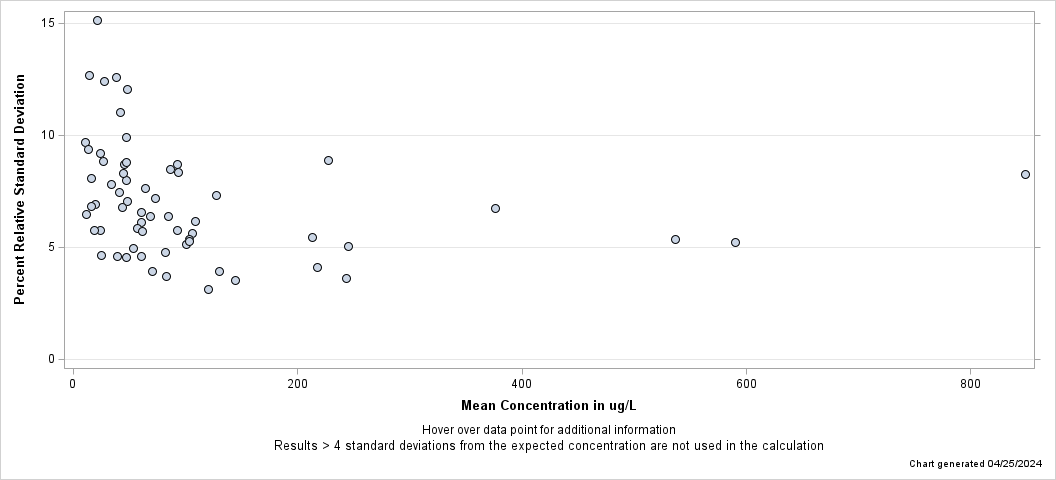
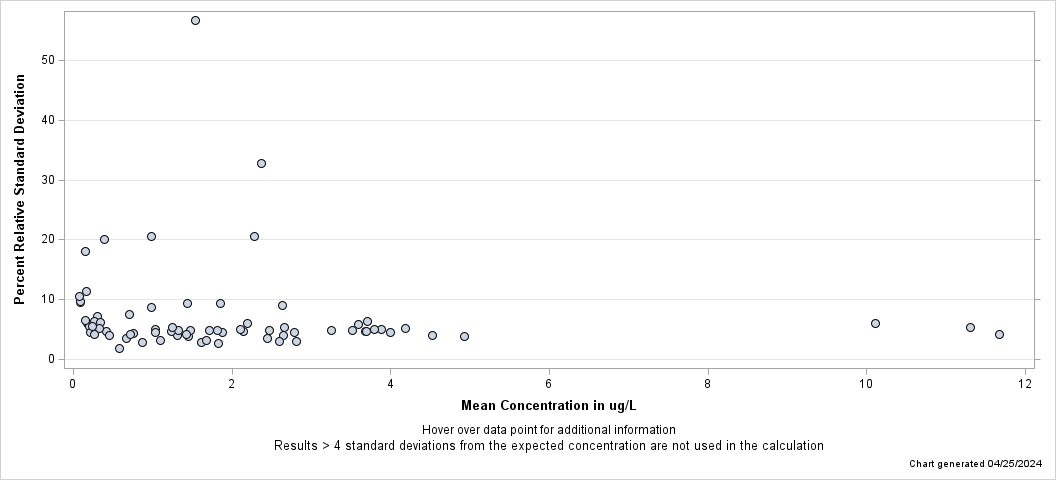
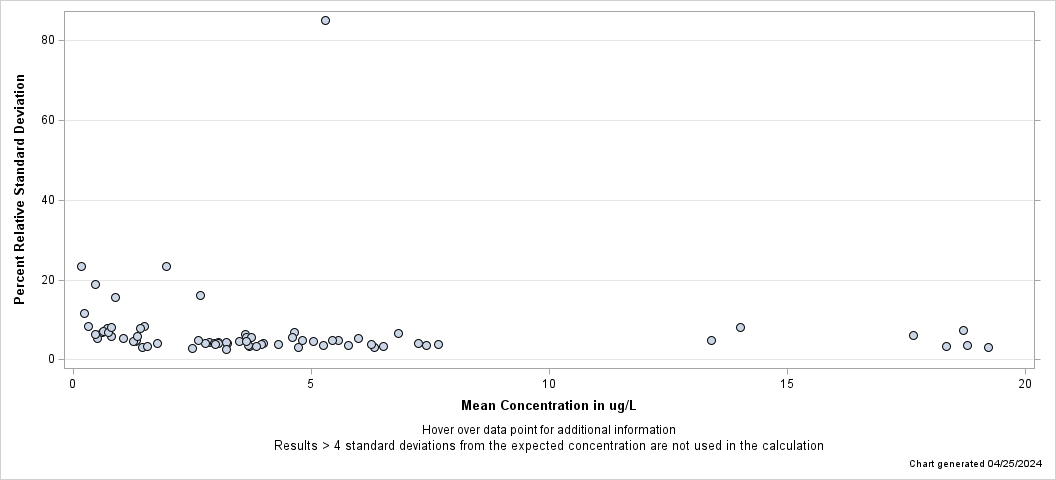
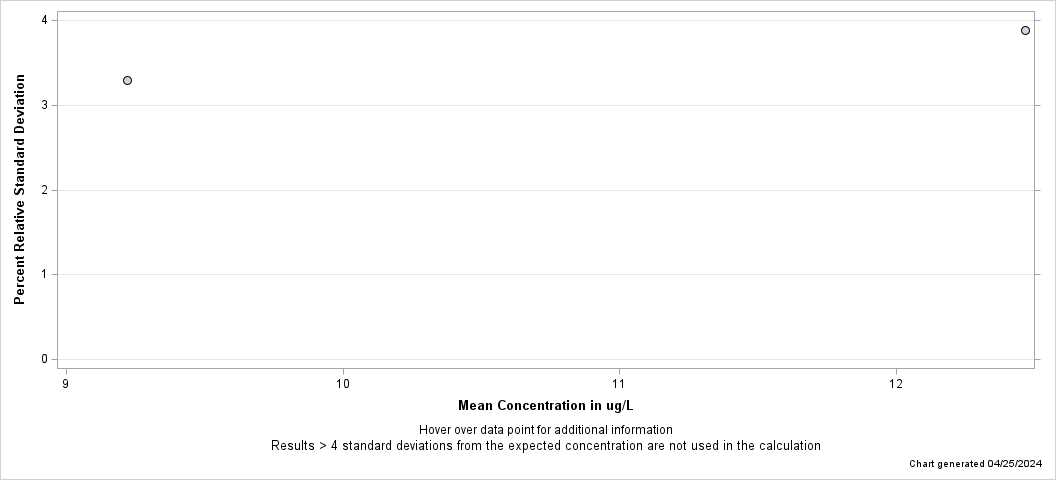
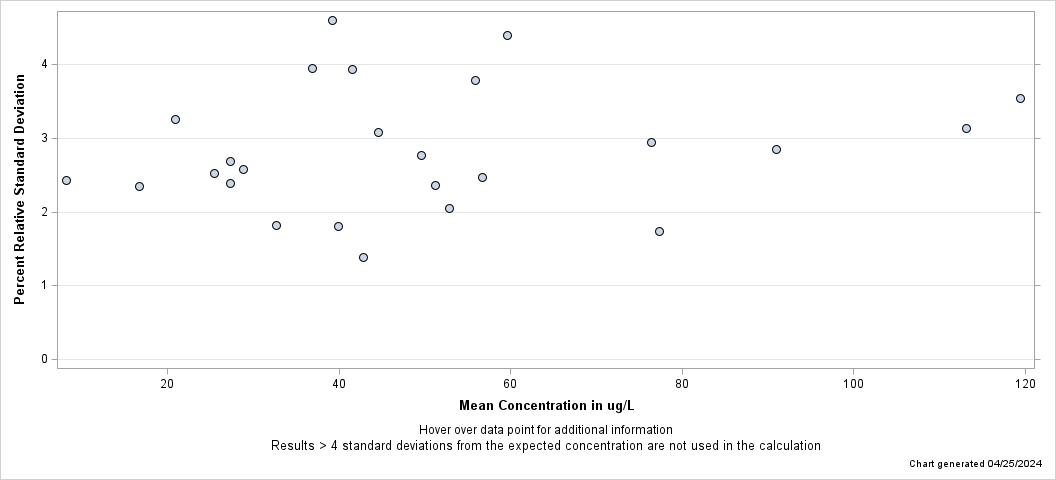
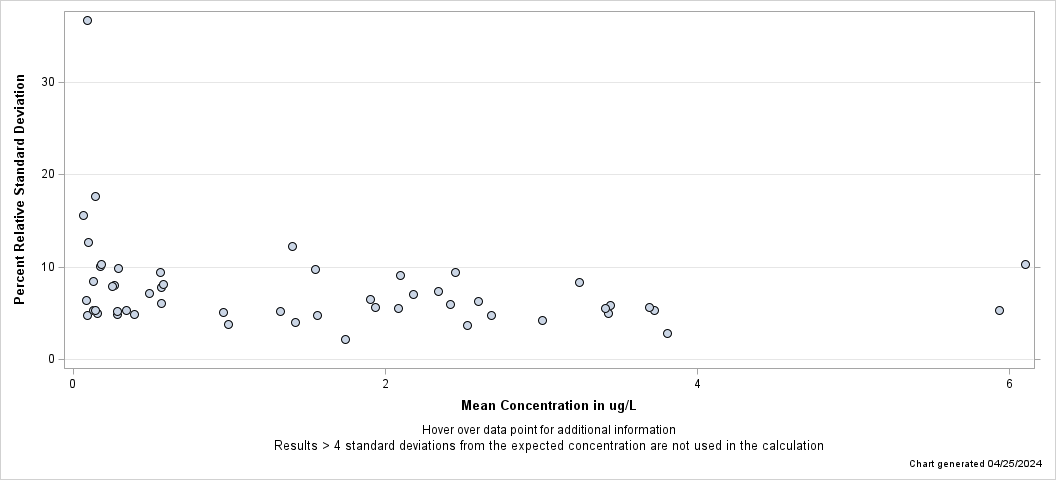
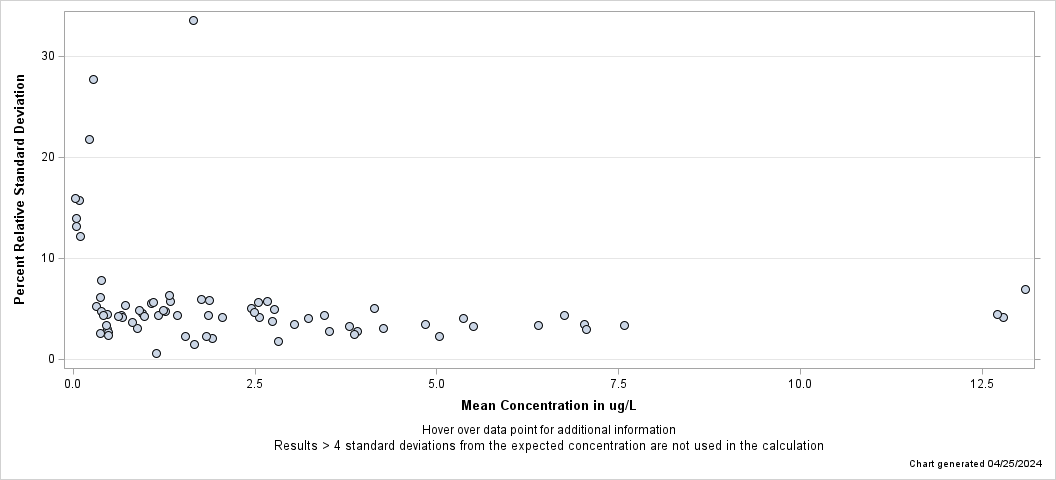
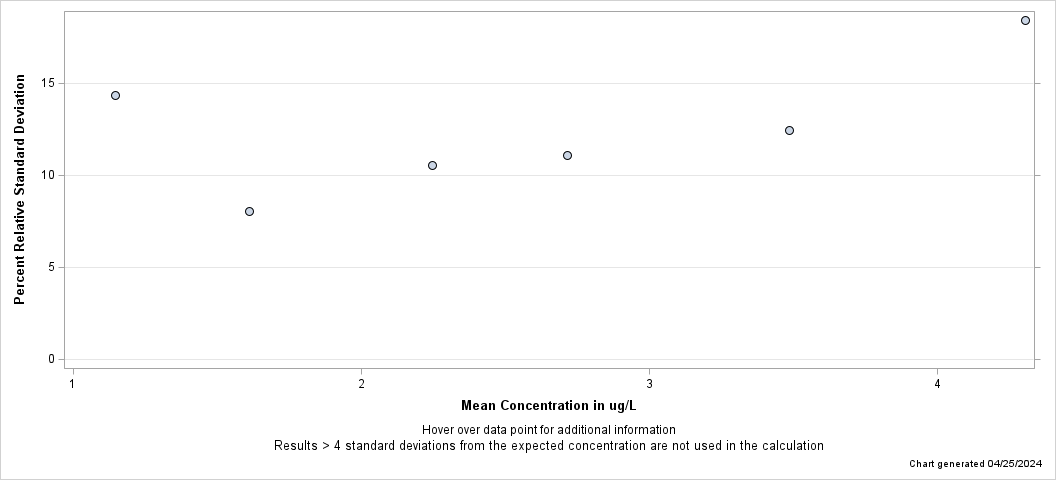
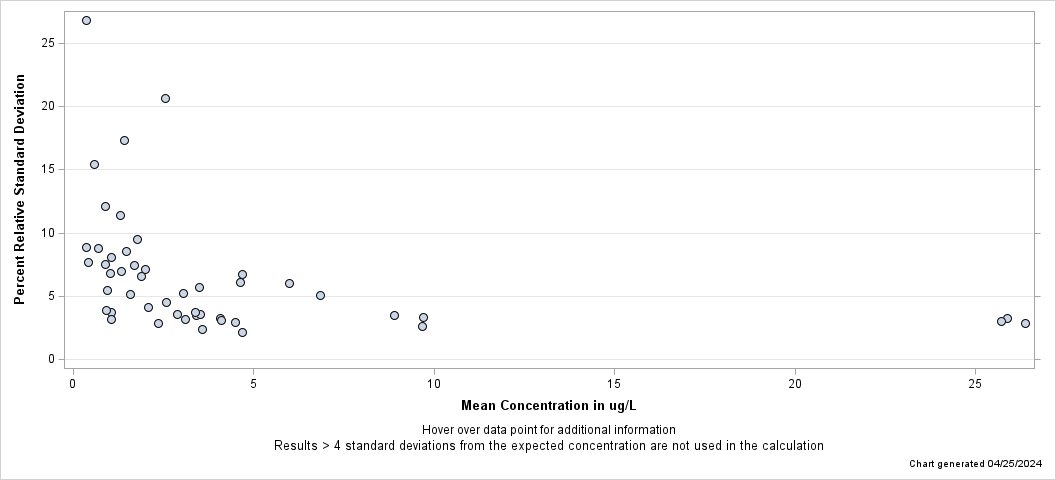
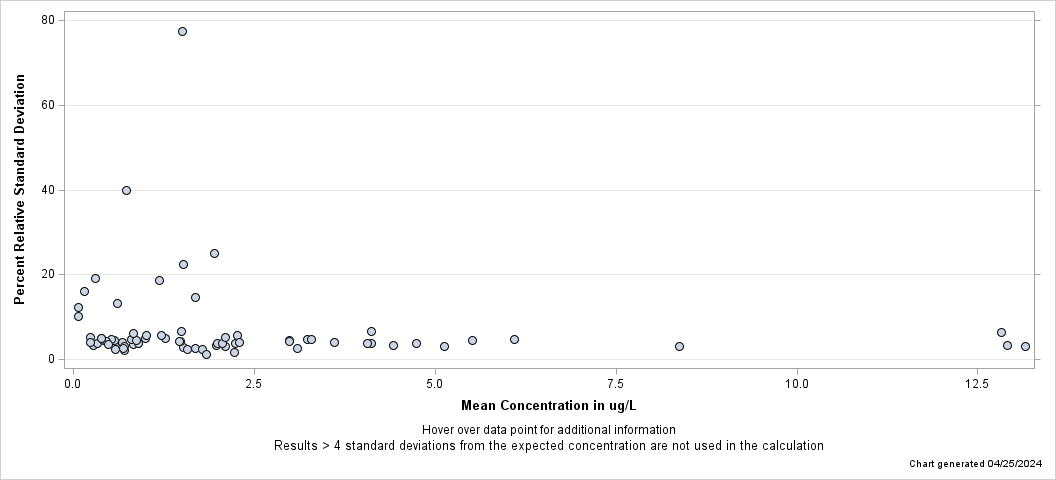
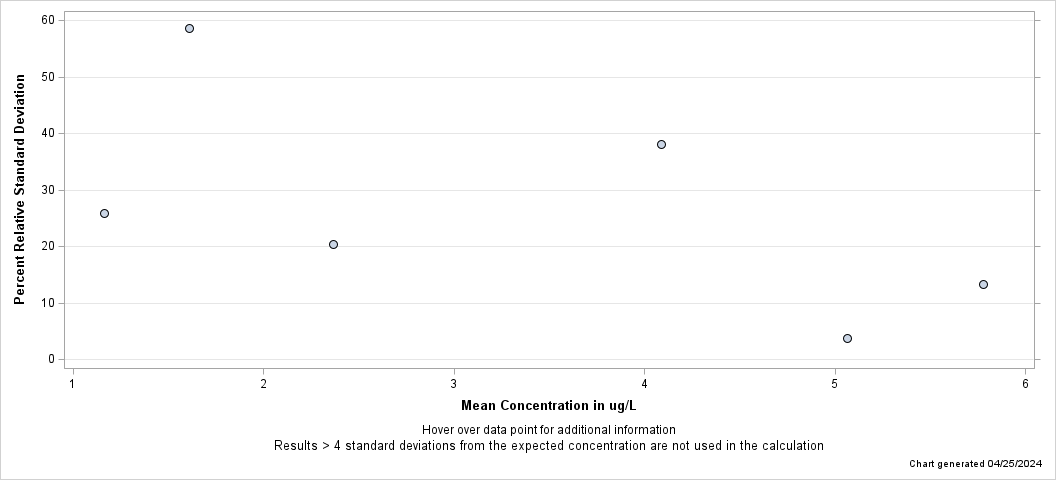
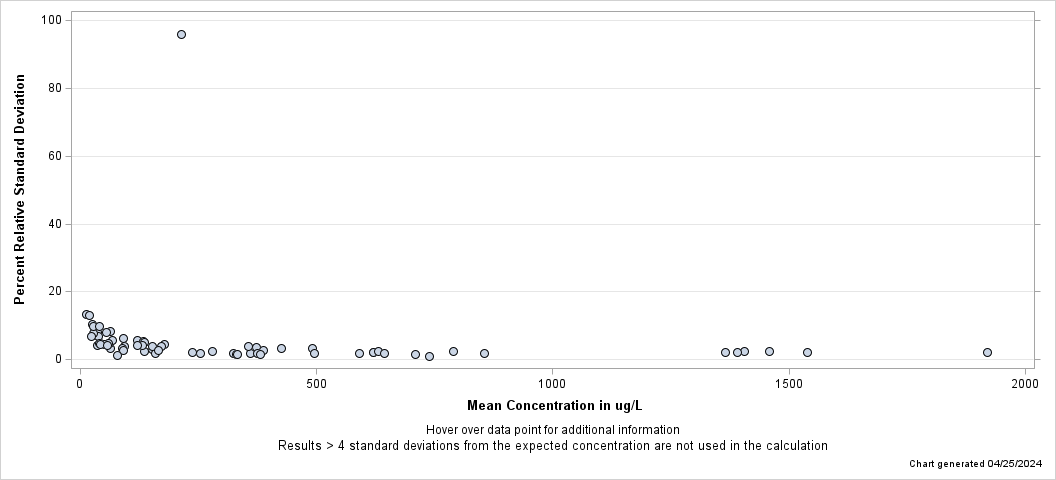
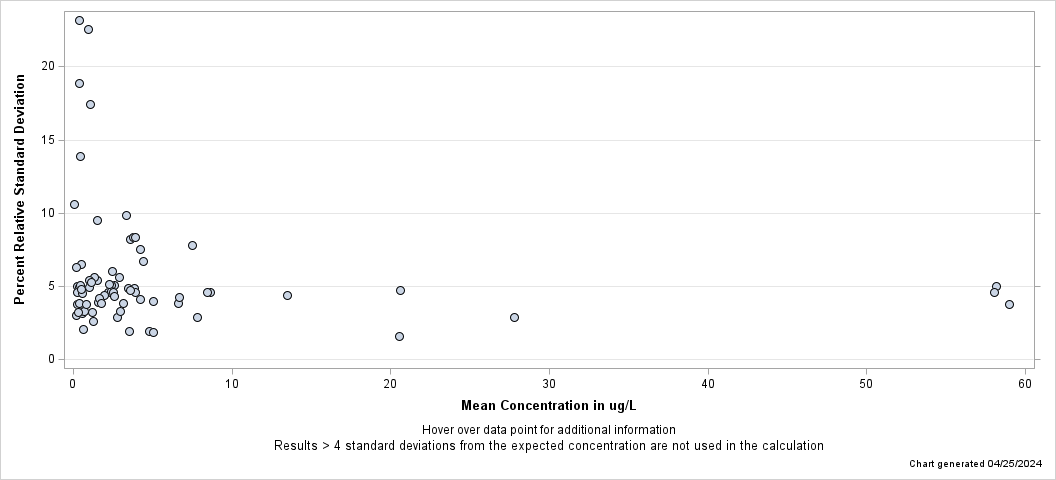
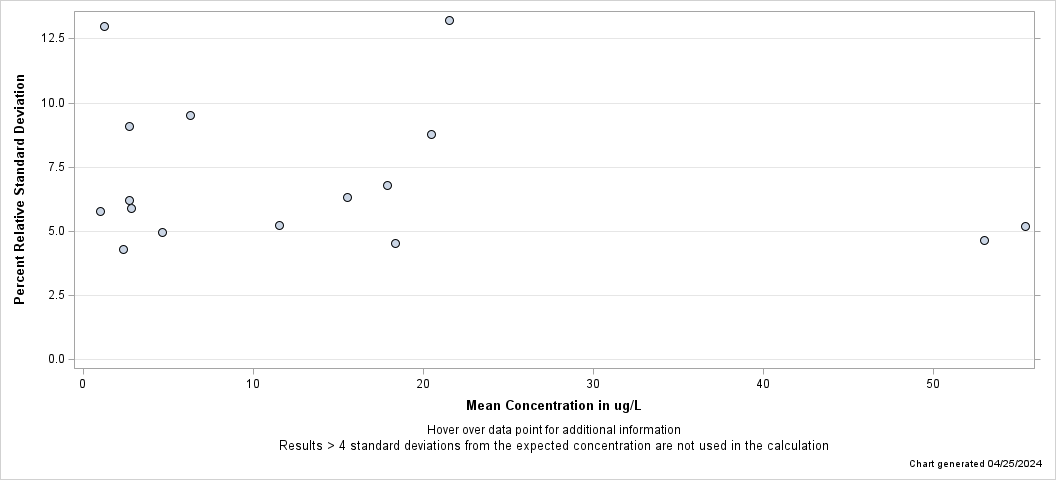
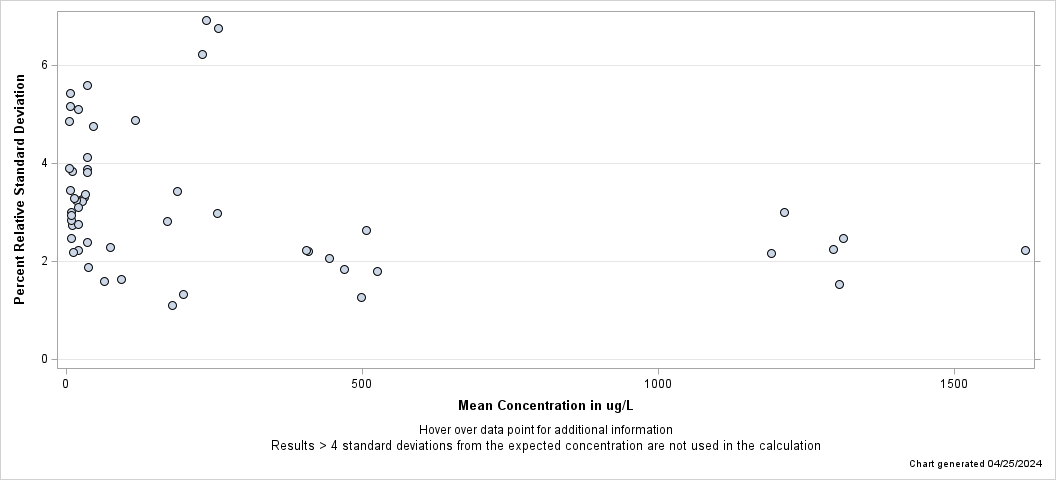
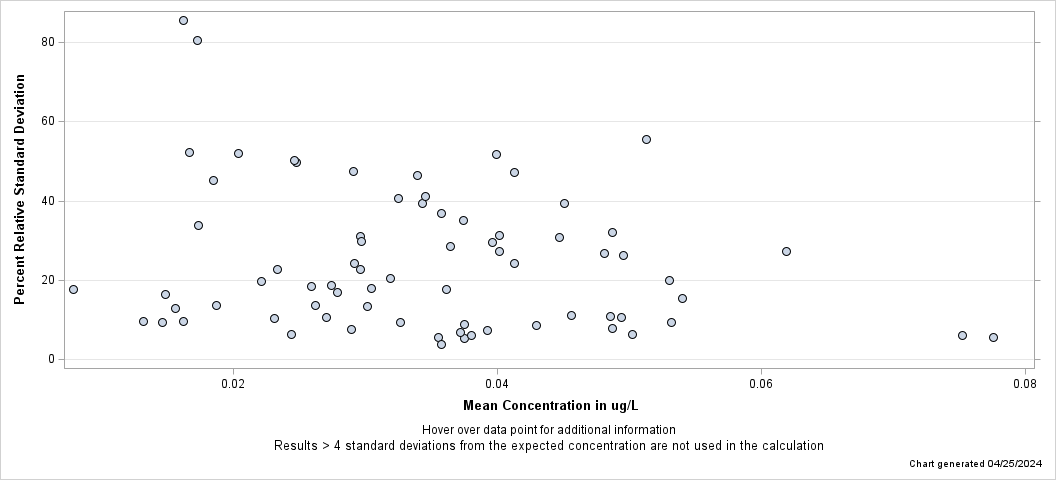
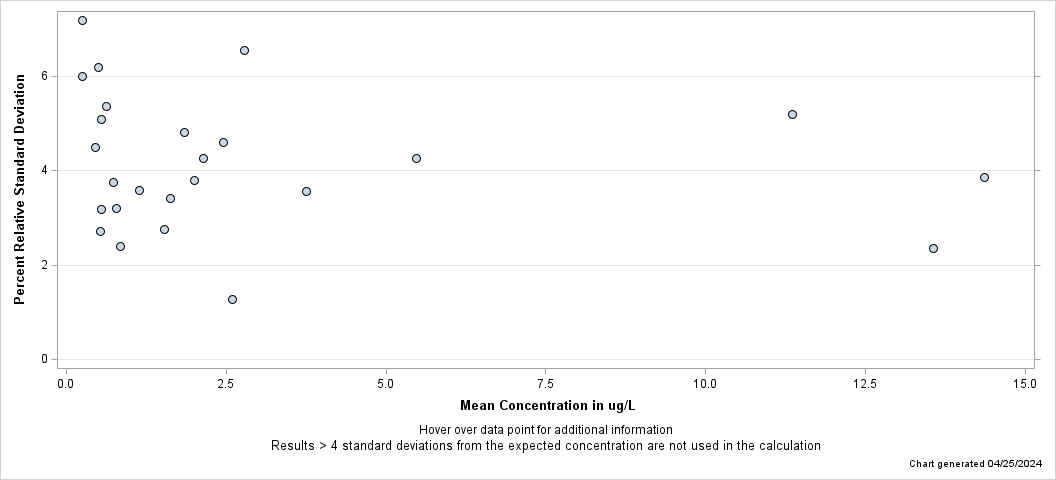
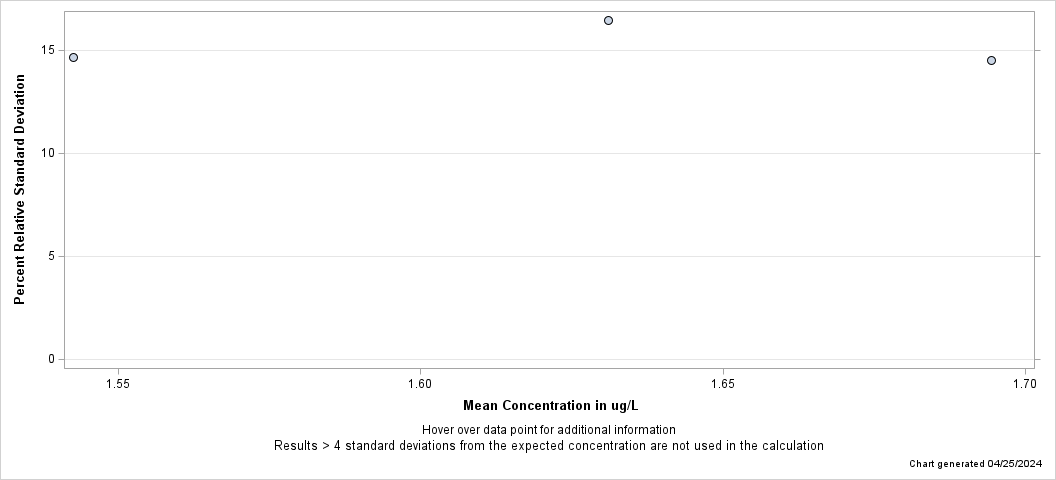
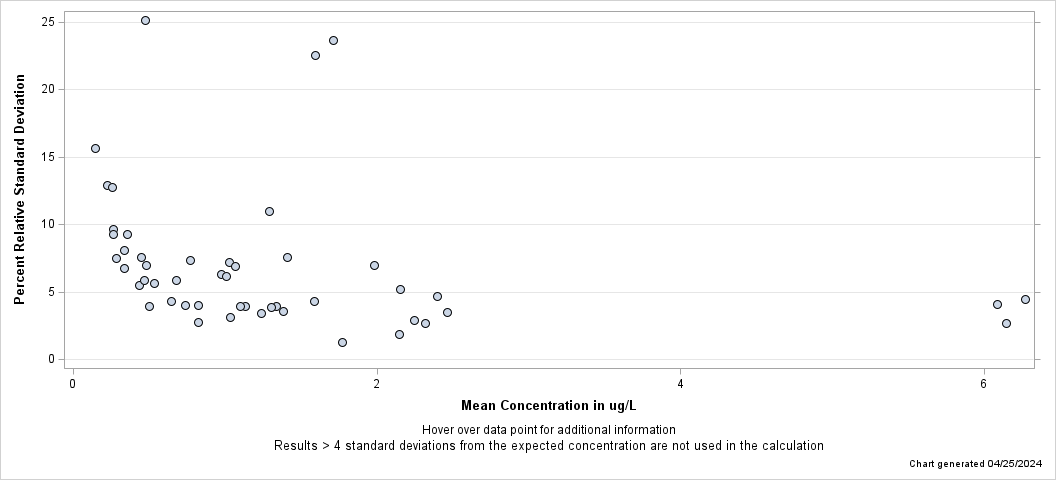
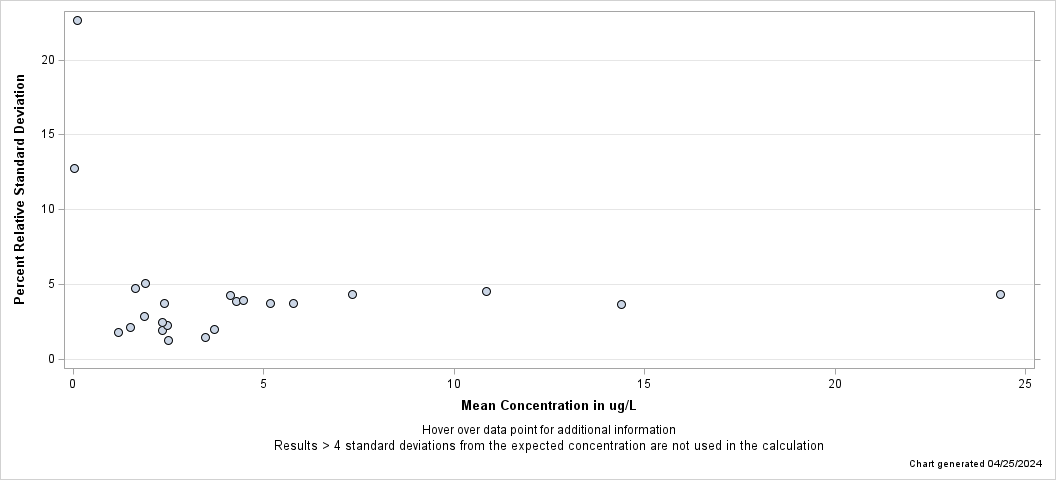
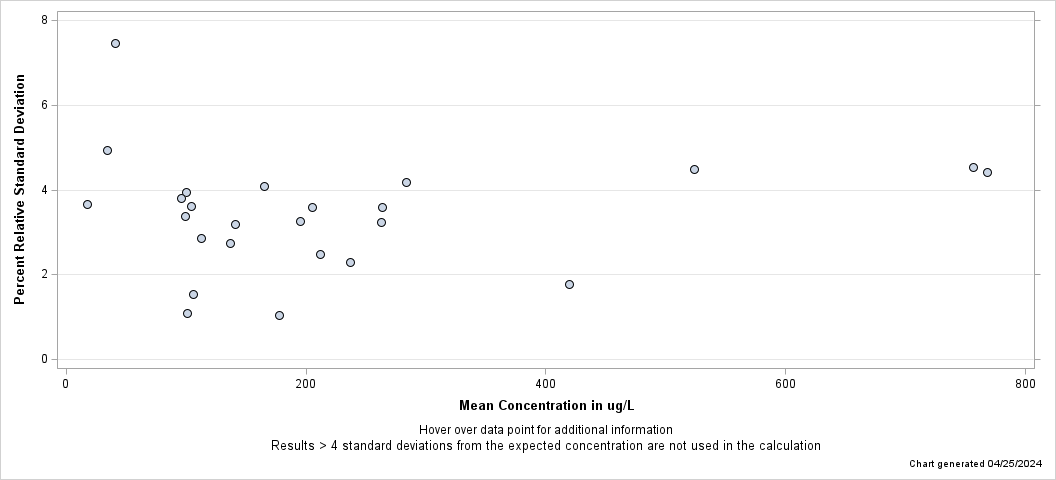
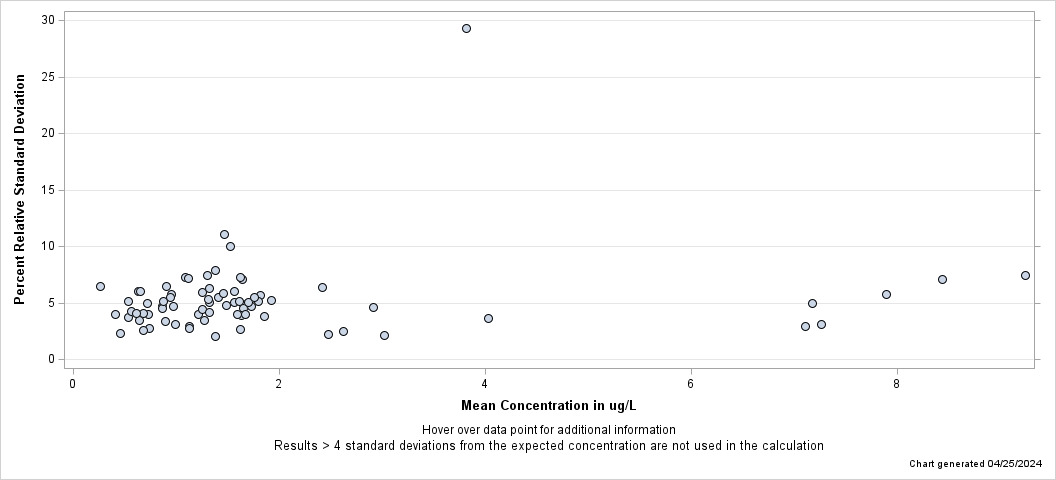
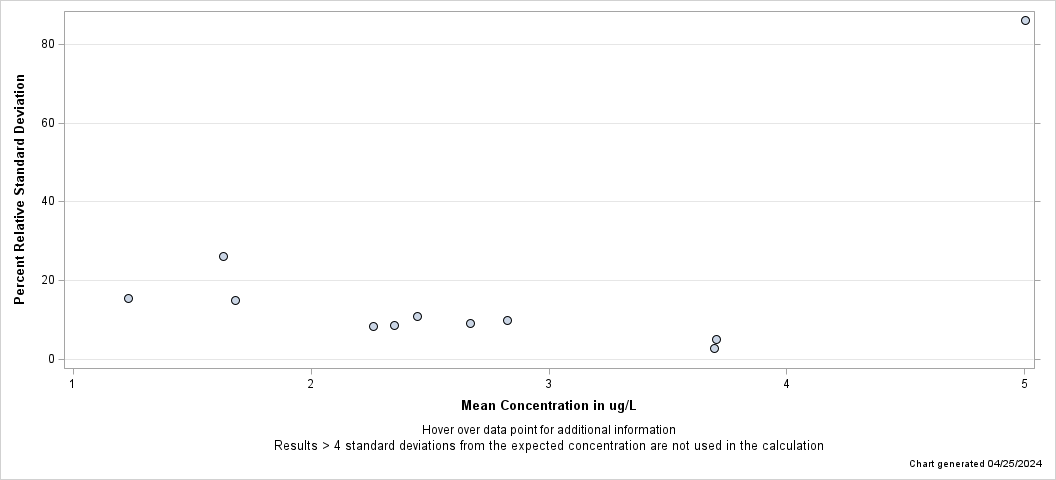
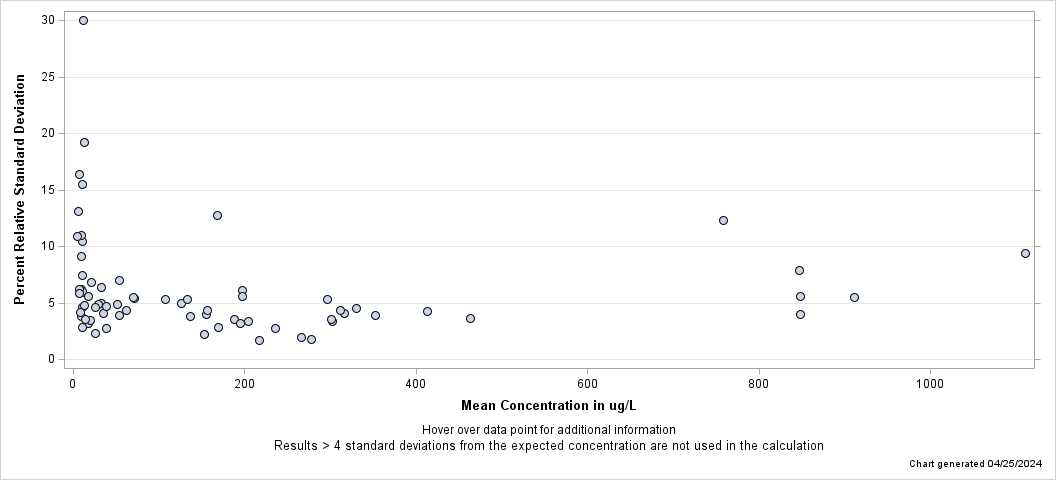
| - Aluminum, fltd, ICP-MS - |
| Percent Relative Standard Deviation |
| Lab: NWQL, PCode: 01106, MCode: PLM43 |
| Dates: 10/13/04 through 01/29/19 |
| Open Data Set |
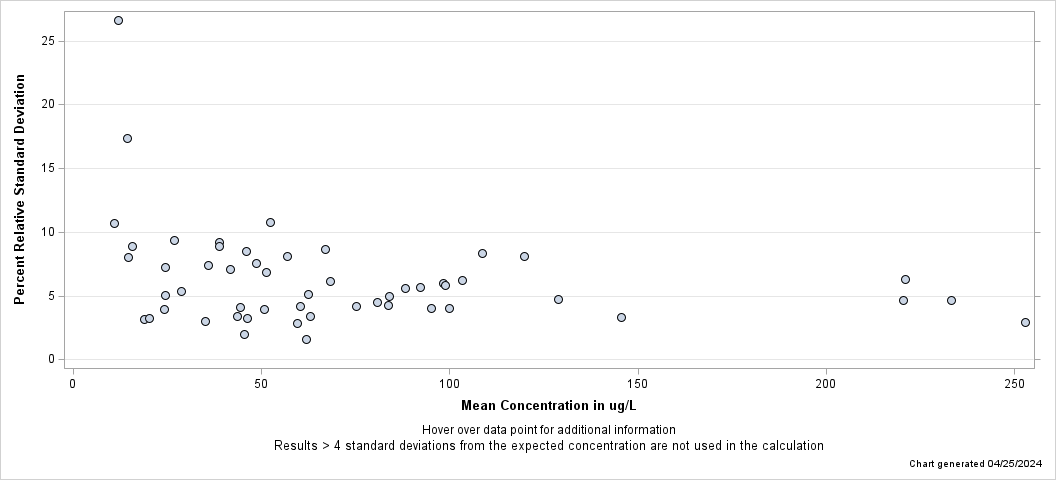
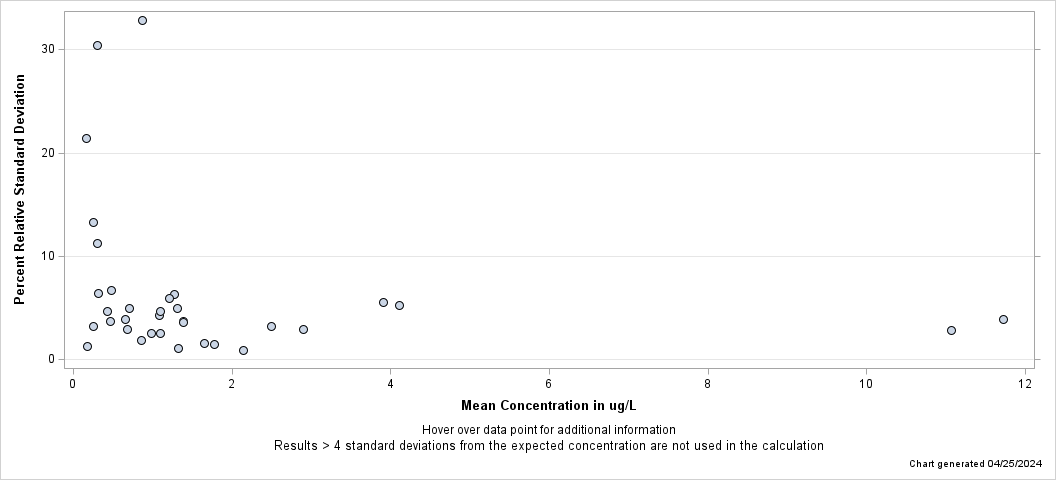
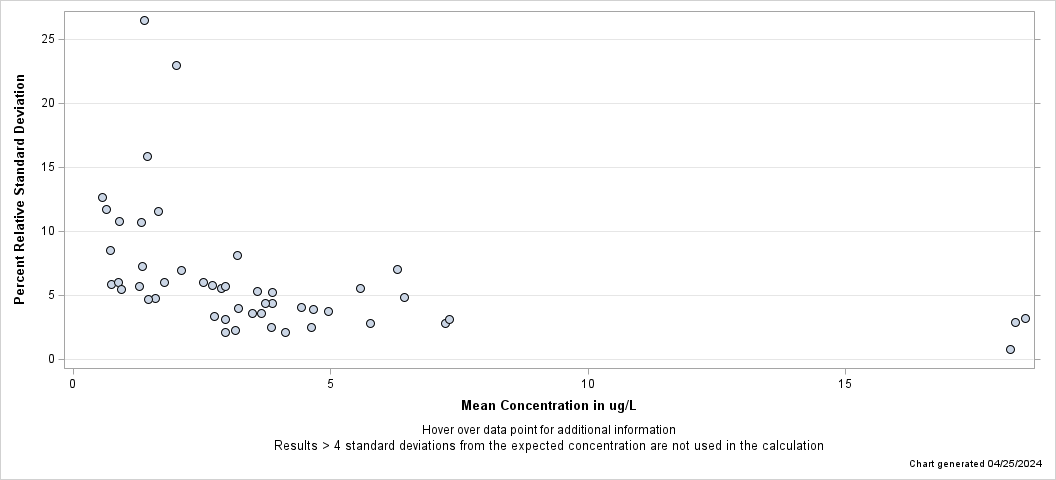
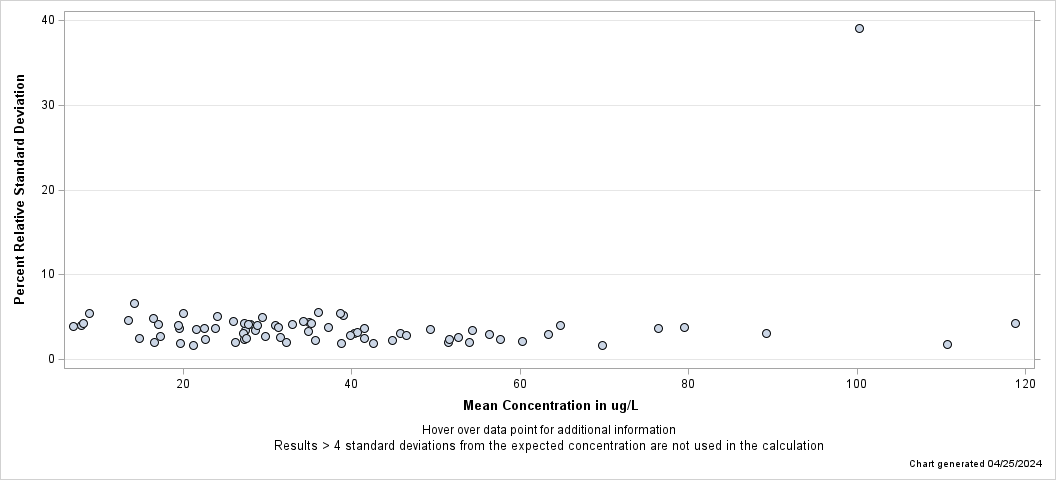
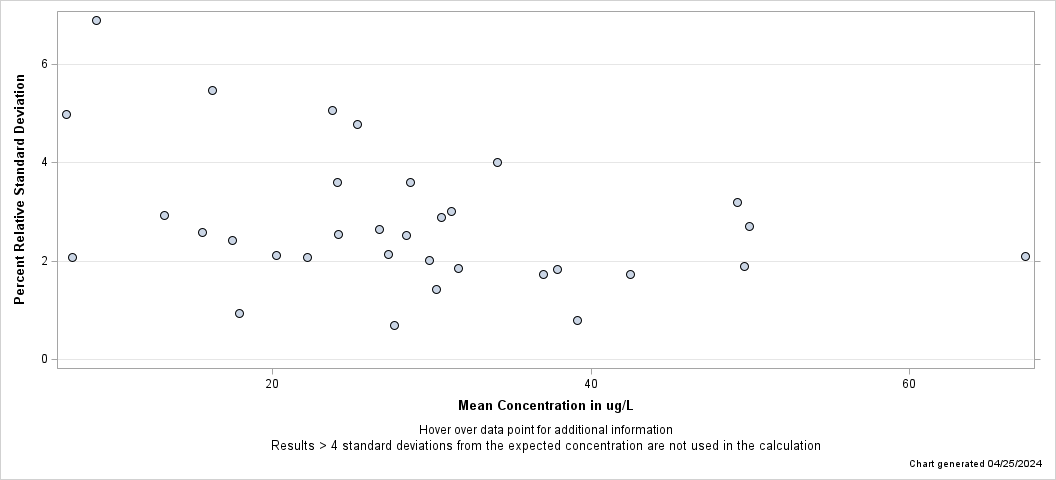
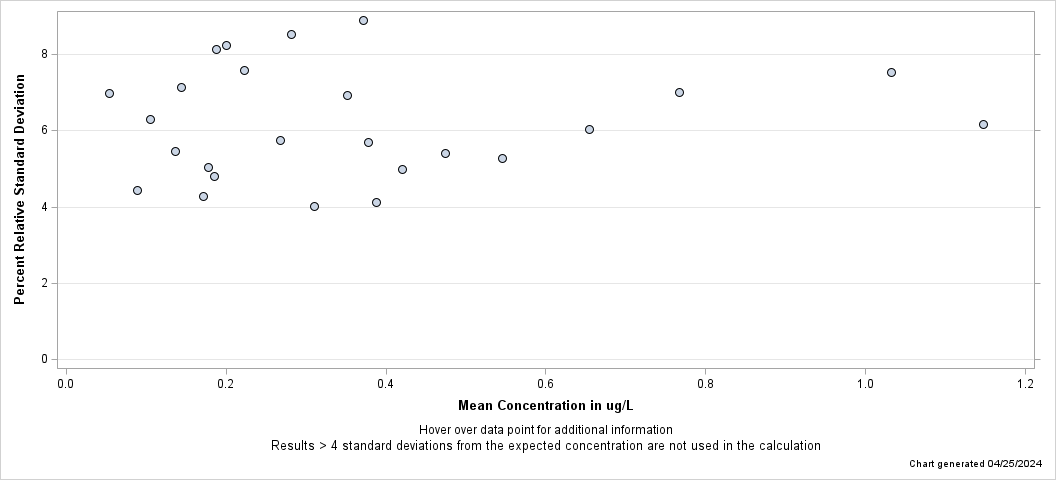
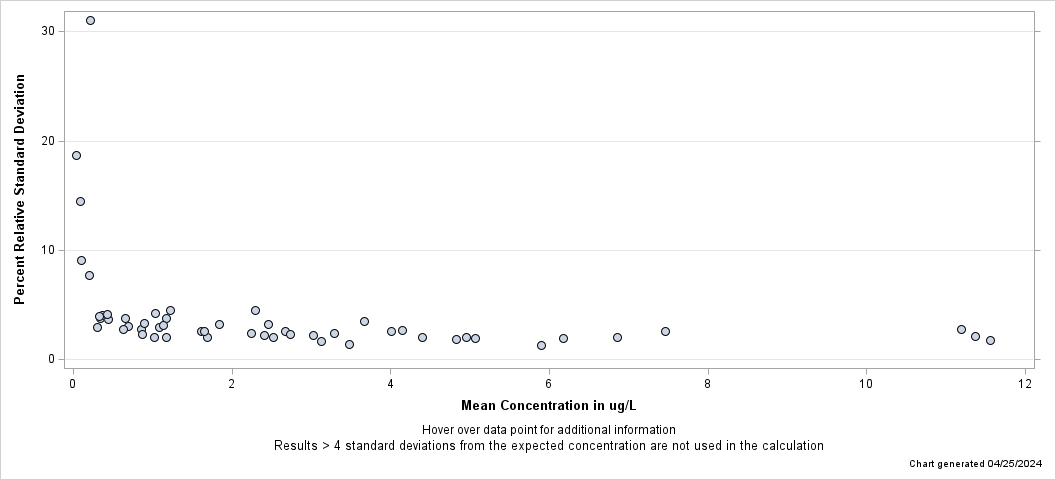
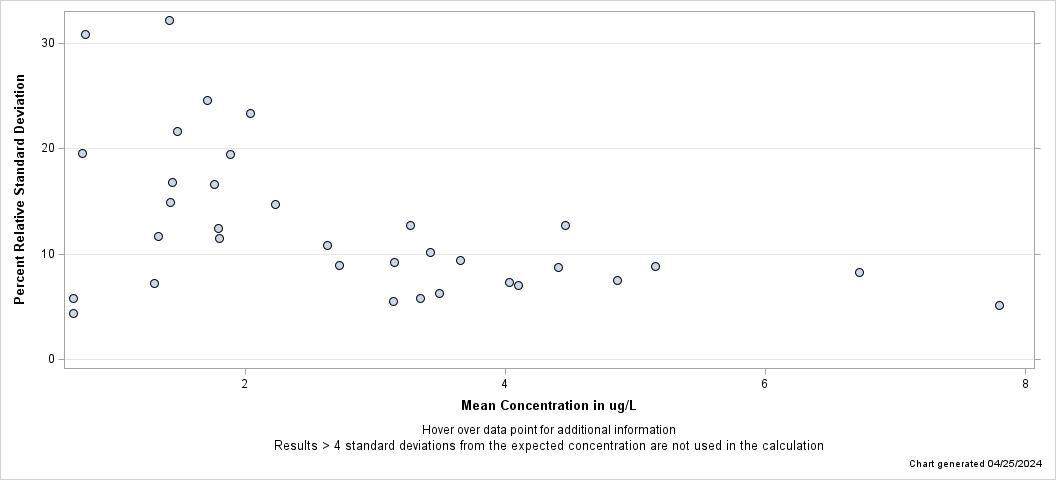
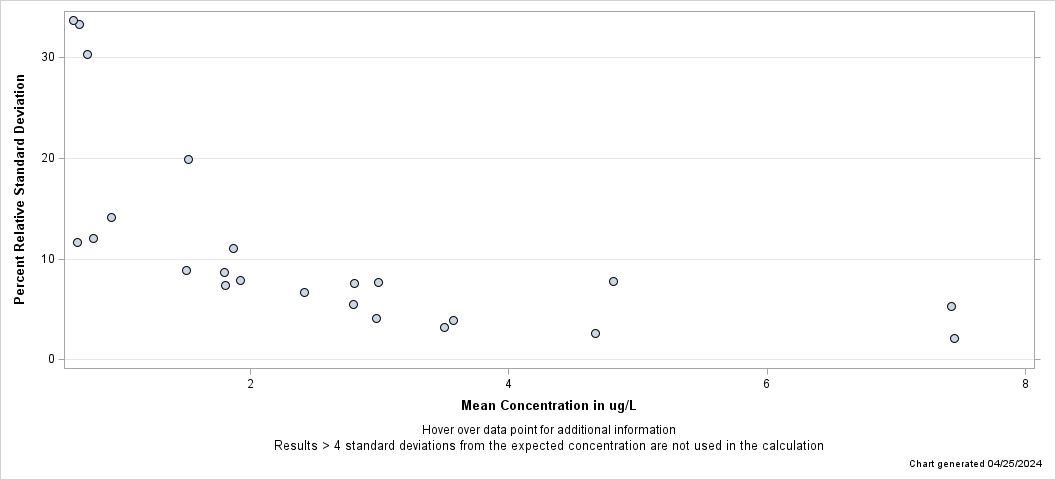
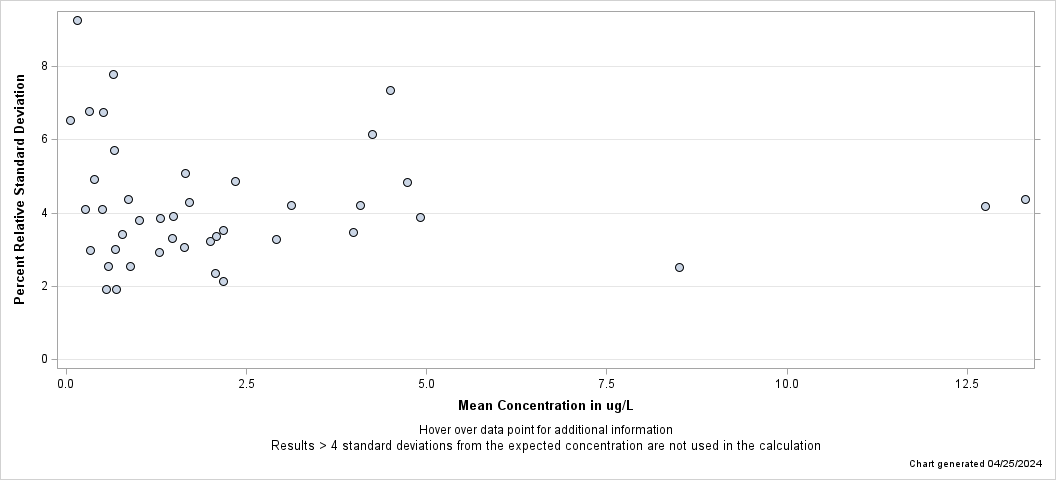
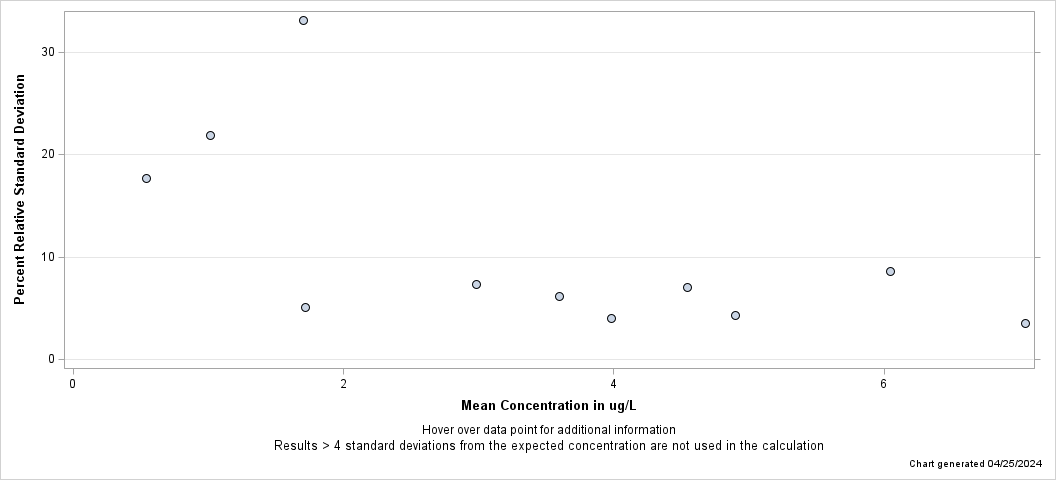
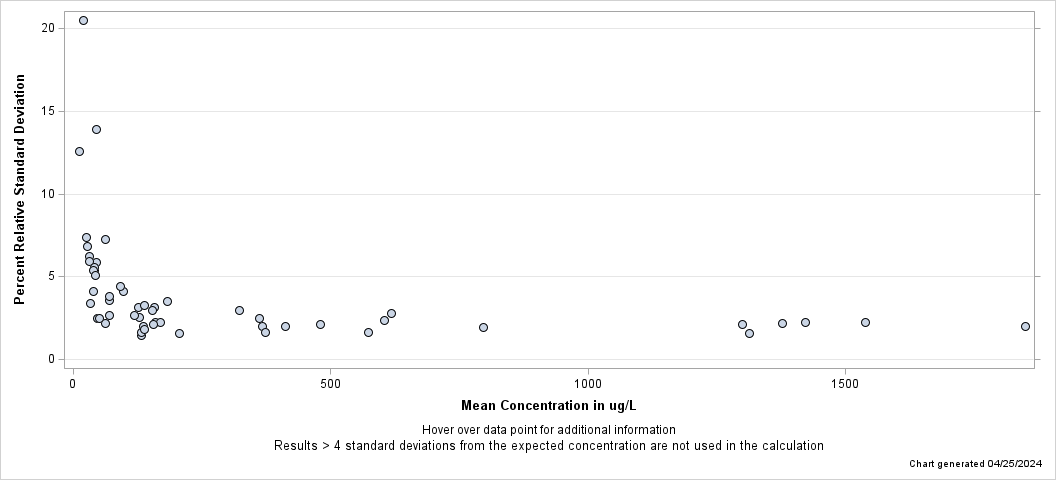
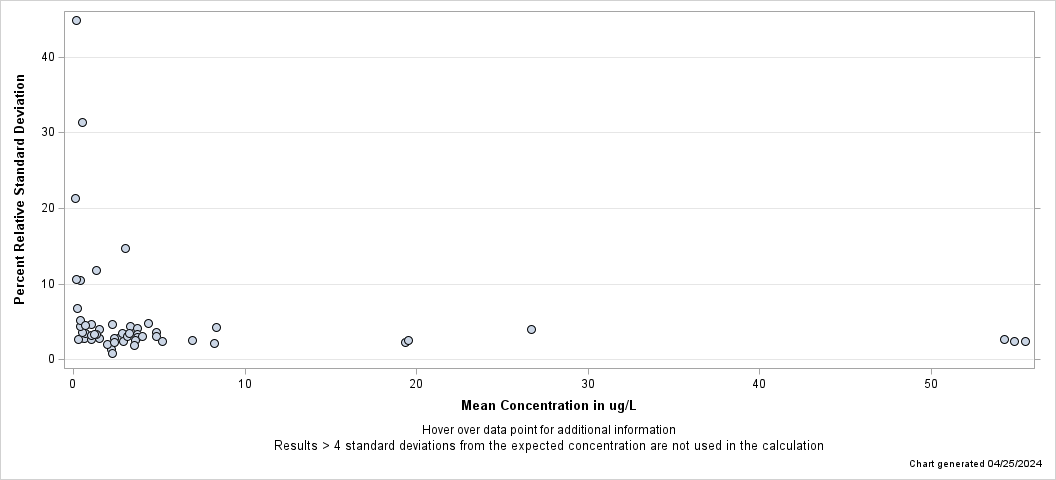
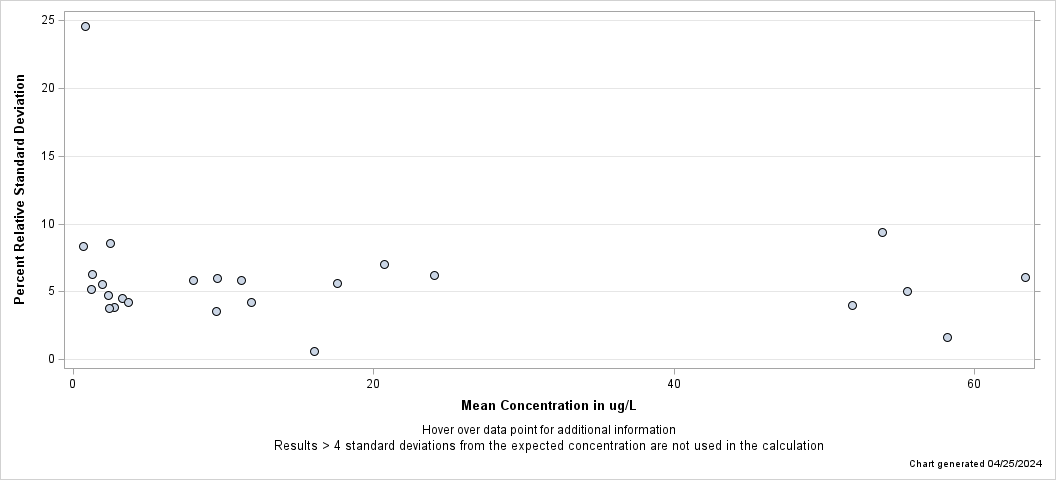
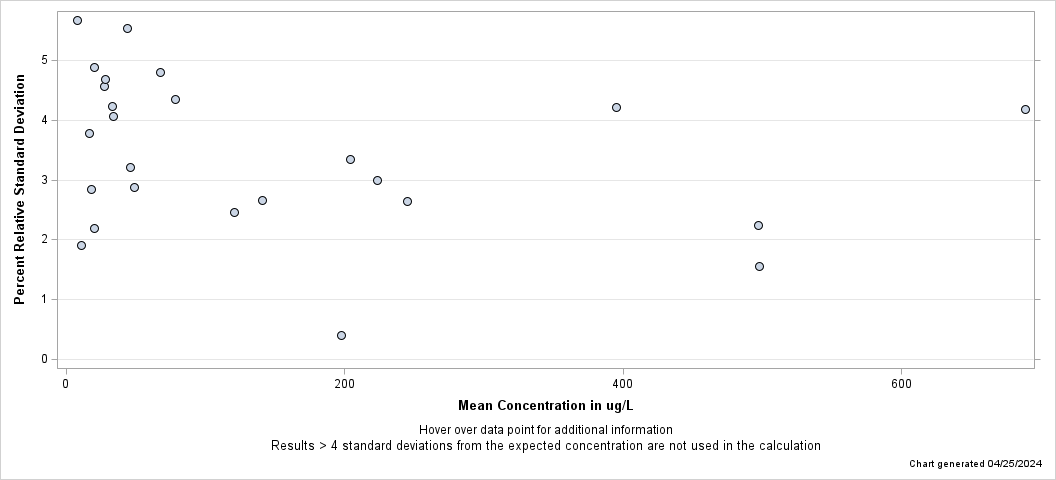
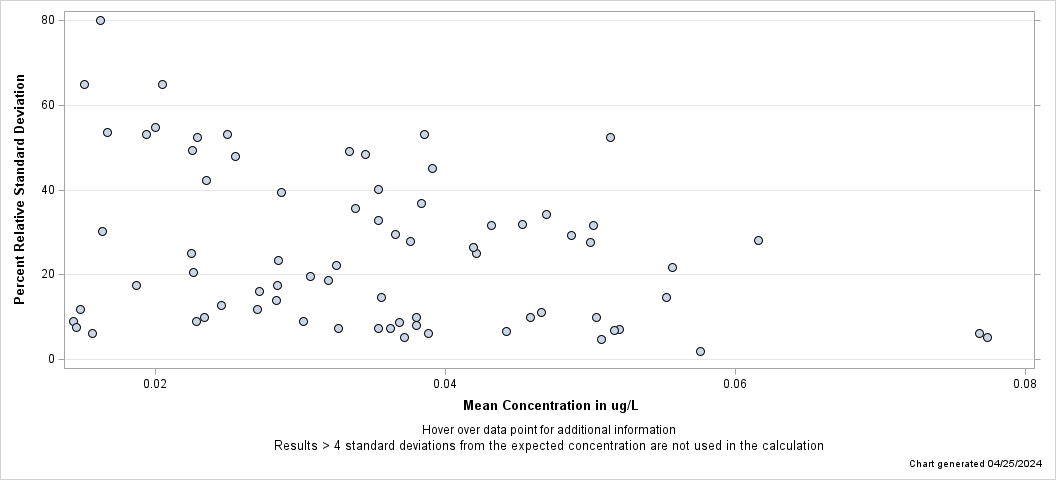
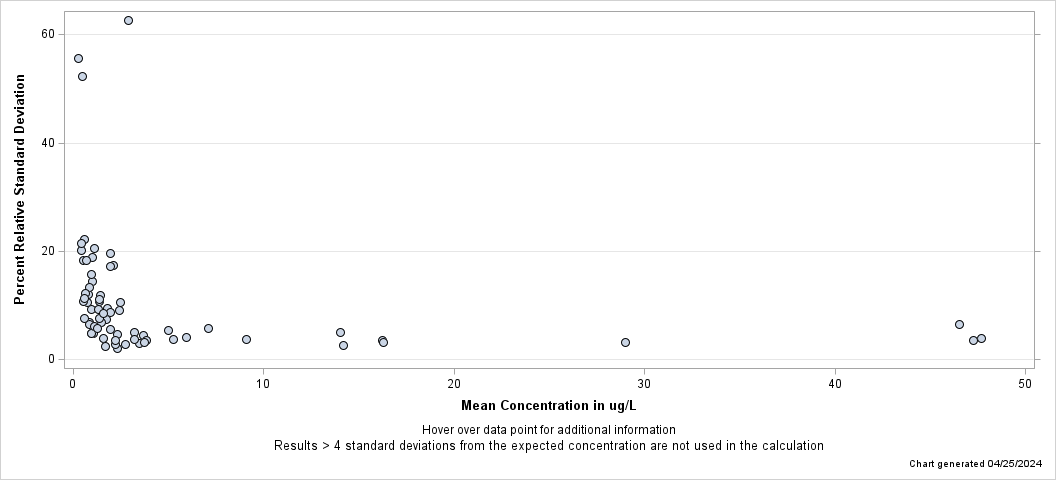
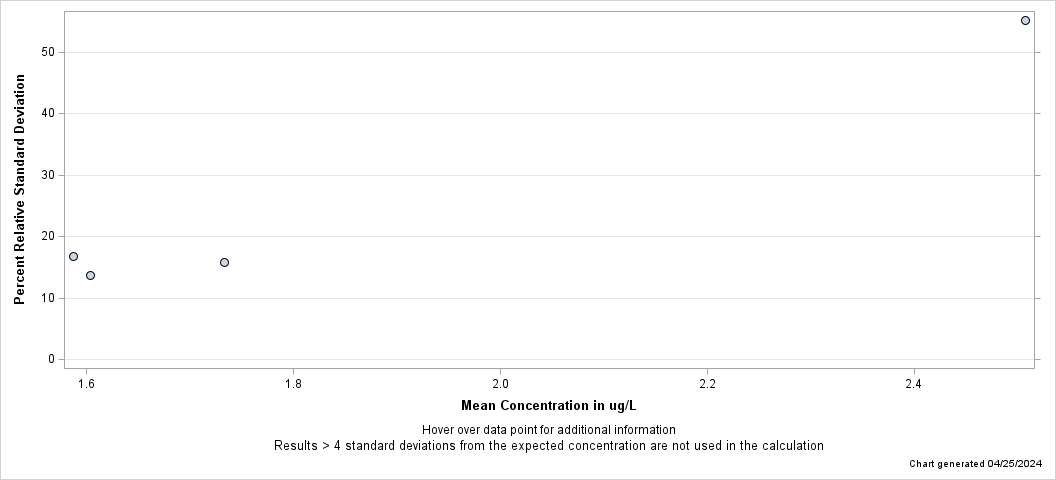
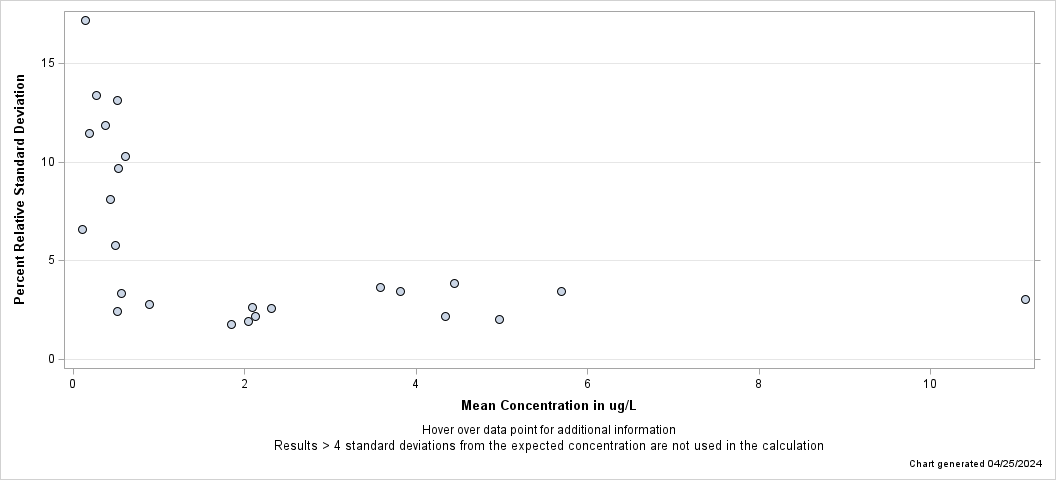
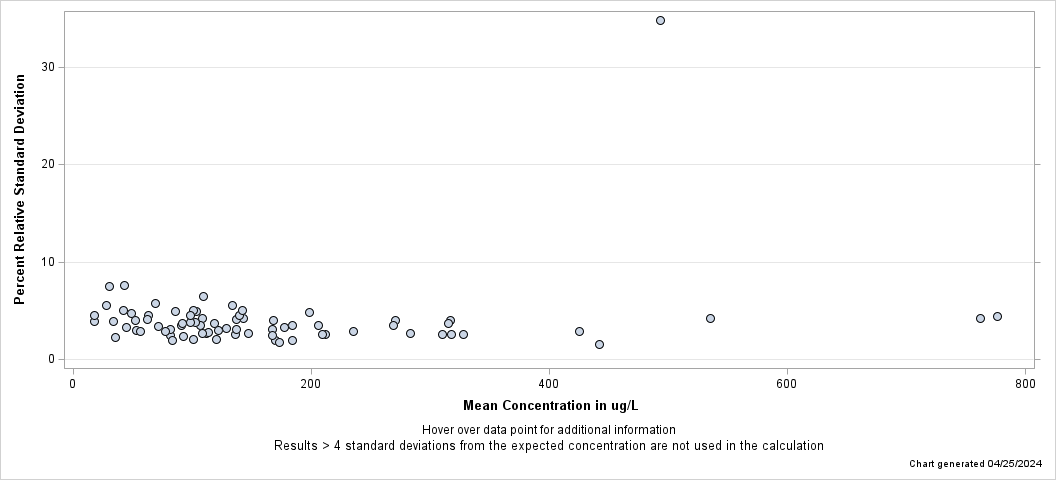
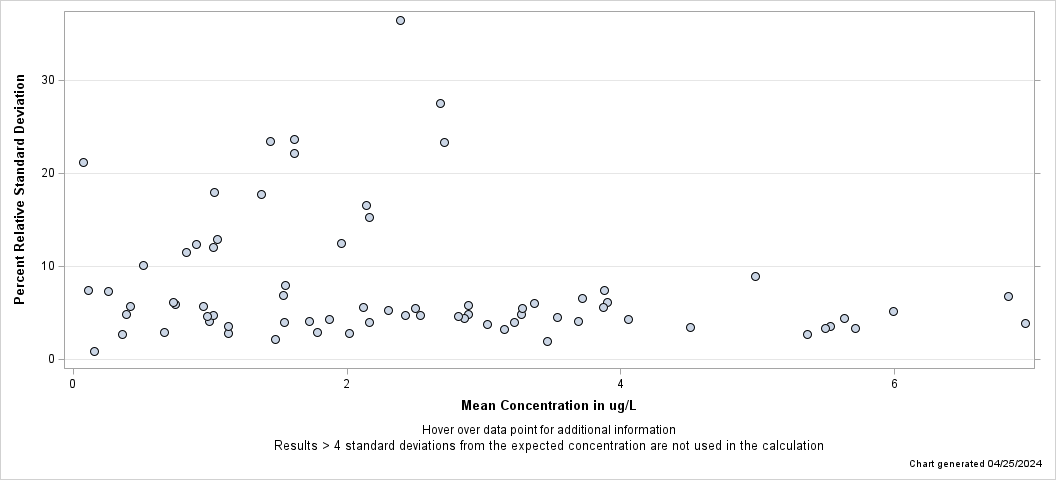
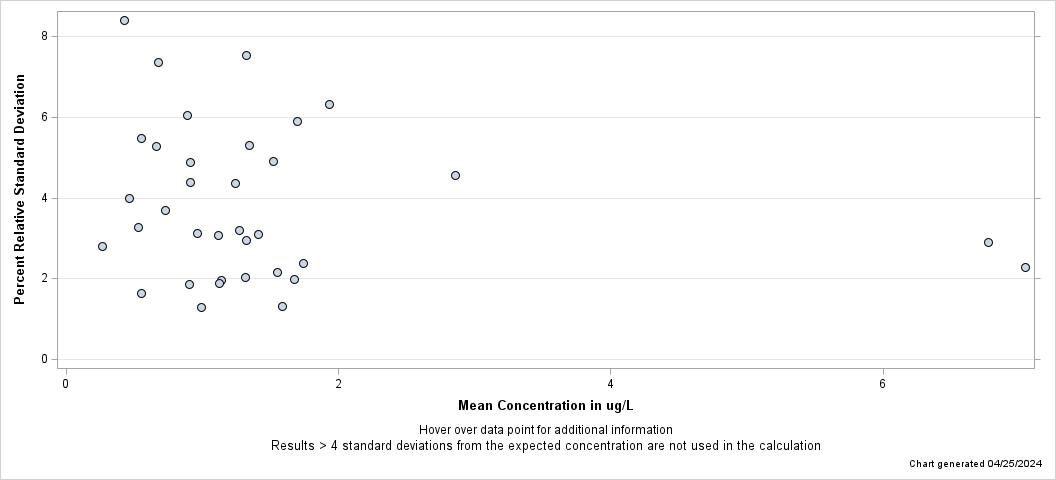
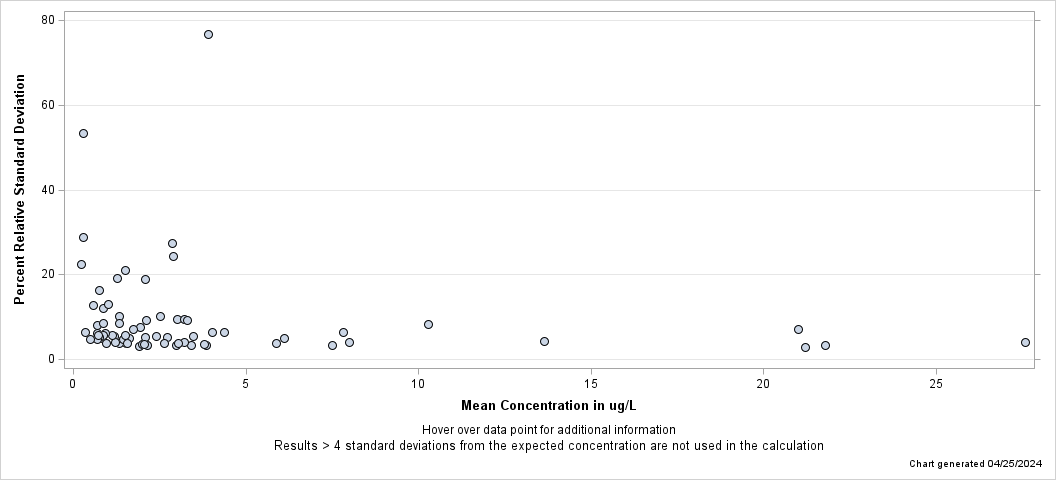
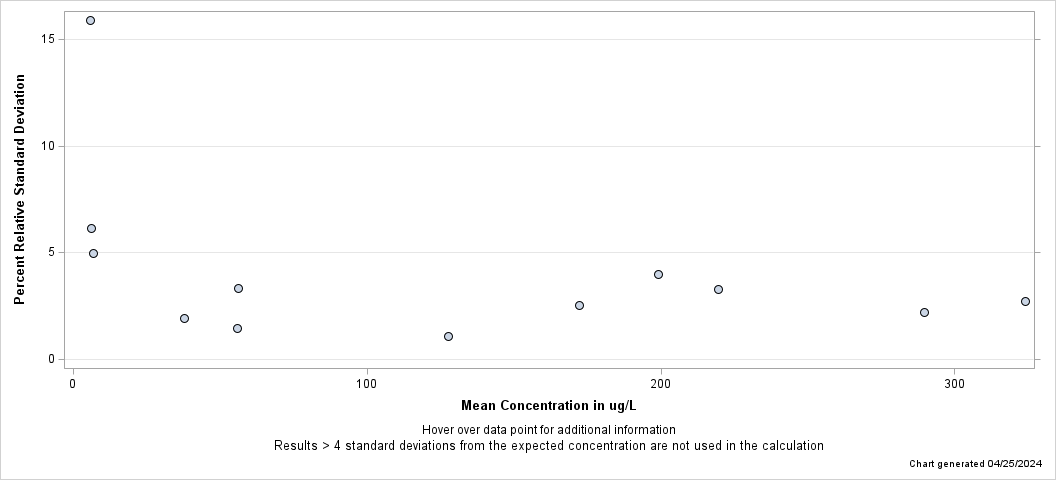
| - Aluminum, fltd, ICP-OES - |
| Percent Relative Standard Deviation |
| Lab: NWQL, PCode: 01106, MCode: PLA13 |
| Dates: 11/05/04 through 08/04/05 |
| Open Data Set |

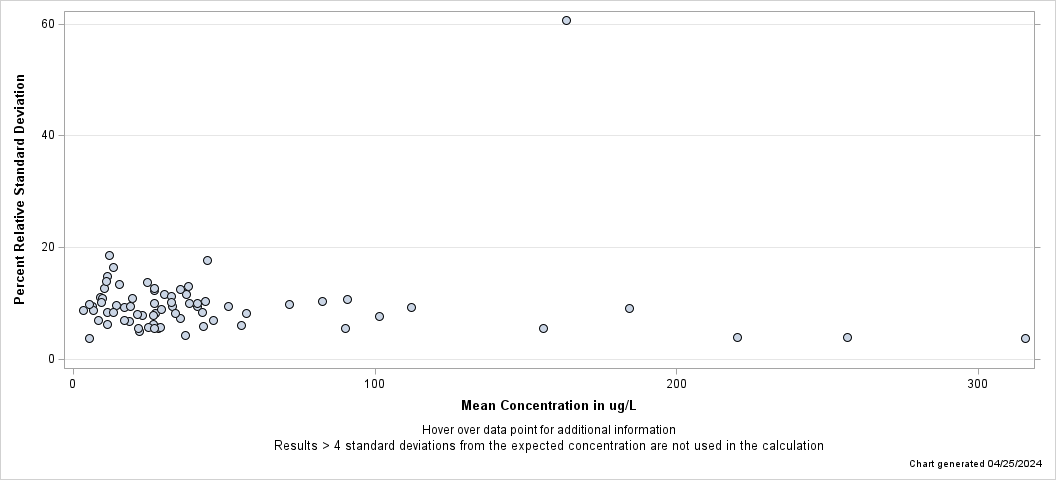
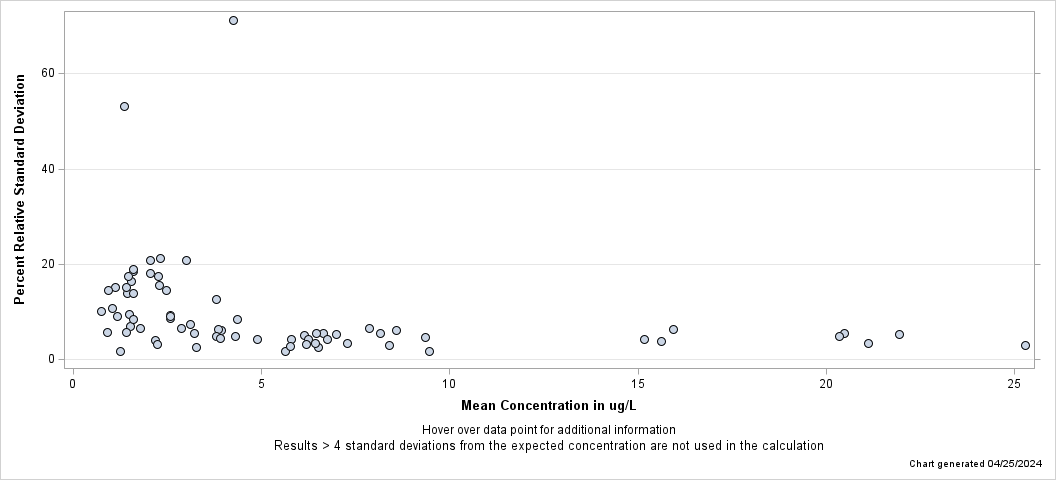
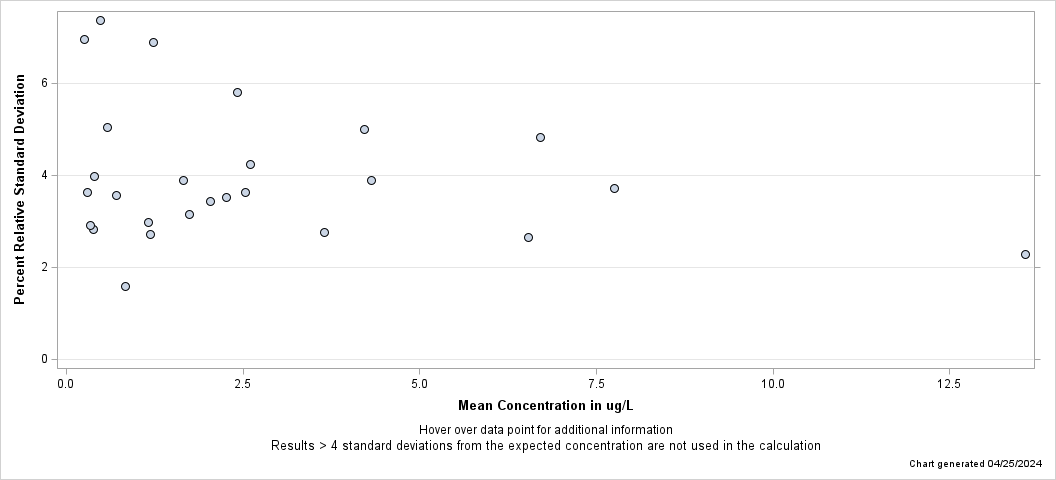
| - Aluminum, unfltd, ICP-MS, recov - |
| Percent Relative Standard Deviation |
| Lab: NWQL, PCode: 01105, MCode: PLM48 |
| Dates: 11/01/04 through 04/30/15 |
| Open Data Set |
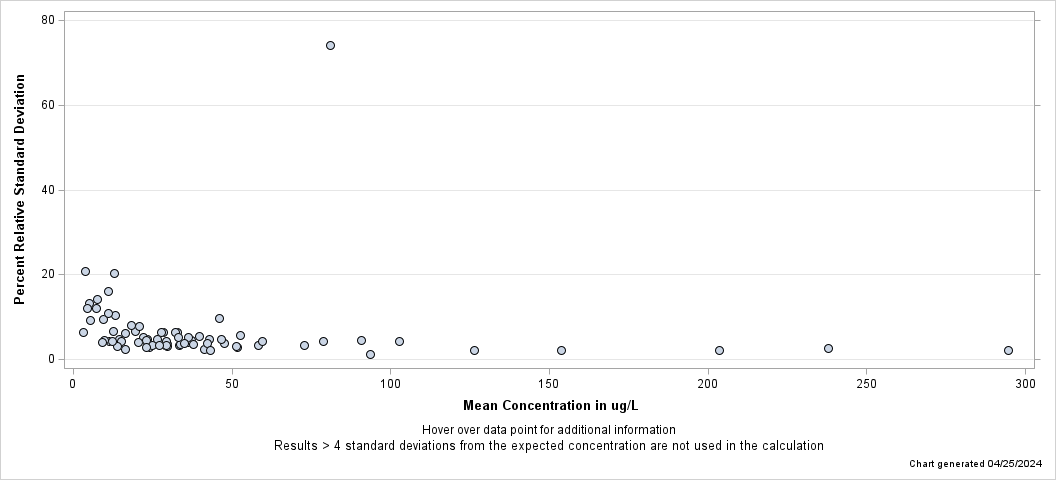
| - Aluminum, unfltd, ICP-MS, recov - |
| Percent Relative Standard Deviation |
| Lab: NWQL, PCode: 01105, MCode: PLM77 |
| Dates: 11/28/18 through 03/31/25 |
| Open Data Set |
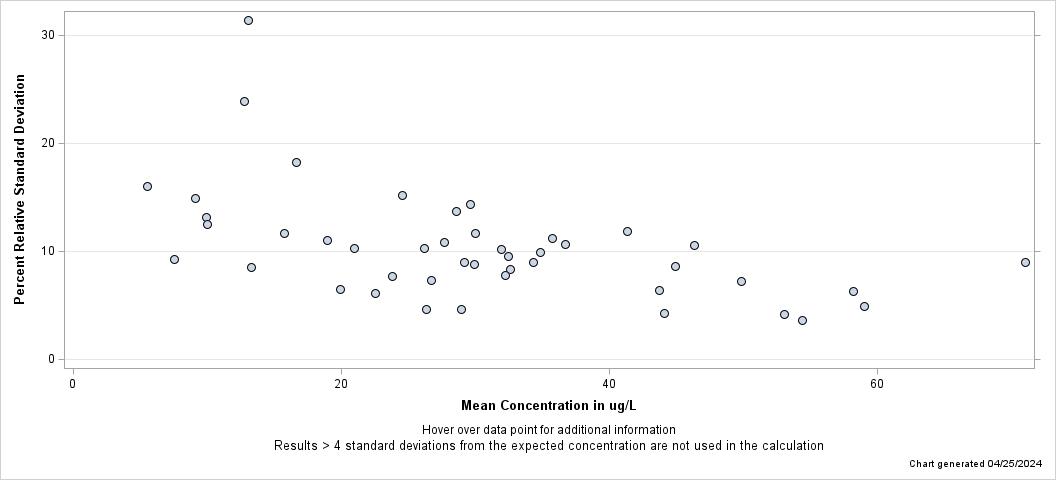
| - Aluminum, unfltd, ICP-MS, recov - |
| Percent Relative Standard Deviation |
| Lab: NWQL, PCode: 01105, MCode: PLM78 |
| Dates: 05/12/15 through 11/27/18 |
| Open Data Set |
| - Antimony, fltd, ICP-MS - |
| Percent Relative Standard Deviation |
| Lab: NWQL, PCode: 01095, MCode: PLM43 |
| Dates: 10/13/04 through 04/09/25 |
| Open Data Set |
| - Antimony, unfltd, ICP-MS, recov - |
| Percent Relative Standard Deviation |
| Lab: NWQL, PCode: 01097, MCode: PLM48 |
| Dates: 11/15/07 through 04/30/15 |
| Open Data Set |
| - Antimony, unfltd, ICP-MS, recov - |
| Percent Relative Standard Deviation |
| Lab: NWQL, PCode: 01097, MCode: PLM78 |
| Dates: 05/12/15 through 04/04/25 |
| Open Data Set |
| - Arsenate [as (V)], IC-ICP-MS - |
| Percent Relative Standard Deviation |
| Lab: NWQL, PCode: 62453, MCode: PLM36 |
| Dates: 10/29/04 through 10/25/07 |
| Open Data Set |

| - Arsenate [as (V)], IC-ICP-MS (w/org) - |
| Percent Relative Standard Deviation |
| Lab: NWQL, PCode: 62453, MCode: PLM35 |
| Dates: 11/16/04 through 10/12/07 |
| Open Data Set |

| - Arsenic, FIL, GFAA - |
| Percent Relative Standard Deviation |
| Lab: NWQL, PCode: 01000, MCode: GF085 |
| Dates: 10/12/04 through 08/24/05 |
| Open Data Set |

| - Arsenic, UNF, GFAA - |
| Percent Relative Standard Deviation |
| Lab: NWQL, PCode: 01002, MCode: GF096 |
| Dates: 10/14/04 through 08/31/05 |
| Open Data Set |
| - Arsenic, fltd, ICP-MS - |
| Percent Relative Standard Deviation |
| Lab: NWQL, PCode: 01000, MCode: PLM40 |
| Dates: 10/13/04 through 10/06/05 |
| Open Data Set |

| - Arsenic, fltd, cICP-MS - |
| Percent Relative Standard Deviation |
| Lab: NWQL, PCode: 01000, MCode: PLM10 |
| Dates: 09/09/05 through 04/09/25 |
| Open Data Set |
| - Arsenic, unfltd, cICP-MS, recov - |
| Percent Relative Standard Deviation |
| Lab: NWQL, PCode: 01002, MCode: PLM11 |
| Dates: 09/20/05 through 07/26/16 |
| Open Data Set |
| - Arsenic, unfltd, cICP-MS, recov - |
| Percent Relative Standard Deviation |
| Lab: NWQL, PCode: 01002, MCode: PLM77 |
| Dates: 05/12/15 through 04/04/25 |
| Open Data Set |
| - Arsenite [AS (III)], IC-ICP-MS - |
| Percent Relative Standard Deviation |
| Lab: NWQL, PCode: 62452, MCode: PLM36 |
| Dates: 10/29/04 through 10/25/07 |
| Open Data Set |
| - Arsenite [AS (III)], IC-ICP-MS (w/org) - |
| Percent Relative Standard Deviation |
| Lab: NWQL, PCode: 62452, MCode: PLM35 |
| Dates: 11/16/04 through 10/12/07 |
| Open Data Set |
| - Barium, fltd, ICP-MS - |
| Percent Relative Standard Deviation |
| Lab: NWQL, PCode: 01005, MCode: PLM43 |
| Dates: 10/13/04 through 04/09/25 |
| Open Data Set |
| - Barium, fltd, ICP-OES - |
| Percent Relative Standard Deviation |
| Lab: NWQL, PCode: 01005, MCode: PLA11 |
| Dates: 10/09/04 through 04/03/25 |
| Open Data Set |
| - Barium, unfltd, ICP-MS, recov - |
| Percent Relative Standard Deviation |
| Lab: NWQL, PCode: 01007, MCode: PLM47 |
| Dates: 11/01/04 through 07/26/16 |
| Open Data Set |
| - Barium, unfltd, ICP-MS, recov - |
| Percent Relative Standard Deviation |
| Lab: NWQL, PCode: 01007, MCode: PLM78 |
| Dates: 05/12/15 through 03/31/25 |
| Open Data Set |
| - Barium, unfltd, ICP-OES, recov - |
| Percent Relative Standard Deviation |
| Lab: NWQL, PCode: 01007, MCode: PLA15 |
| Dates: 10/20/04 through 03/24/15 |
| Open Data Set |
| - Barium, unfltd, ICP-OES, recov - |
| Percent Relative Standard Deviation |
| Lab: NWQL, PCode: 01007, MCode: PLO07 |
| Dates: 05/28/15 through 12/03/16 |
| Open Data Set |
| - Beryllium, fltd, ICP-MS - |
| Percent Relative Standard Deviation |
| Lab: NWQL, PCode: 01010, MCode: PLM43 |
| Dates: 10/13/04 through 04/09/25 |
| Open Data Set |
| - Beryllium, fltd, ICP-OES - |
| Percent Relative Standard Deviation |
| Lab: NWQL, PCode: 01010, MCode: PLA11 |
| Dates: 10/15/04 through 09/29/05 |
| Open Data Set |

| - Beryllium, unfltd, ICP-MS, recov - |
| Percent Relative Standard Deviation |
| Lab: NWQL, PCode: 01012, MCode: PLM47 |
| Dates: 11/01/04 through 04/30/15 |
| Open Data Set |
| - Beryllium, unfltd, ICP-MS, recov - |
| Percent Relative Standard Deviation |
| Lab: NWQL, PCode: 01012, MCode: PLM78 |
| Dates: 05/12/15 through 04/10/25 |
| Open Data Set |
| - Beryllium, unfltd, ICP-OES, recov - |
| Percent Relative Standard Deviation |
| Lab: NWQL, PCode: 01012, MCode: PLA15 |
| Dates: 12/01/08 through 11/12/09 |
| Open Data Set |
| - Boron, fltd, ICP-MS - |
| Percent Relative Standard Deviation |
| Lab: NWQL, PCode: 01020, MCode: PLM40 |
| Dates: 10/13/04 through 04/09/25 |
| Open Data Set |
| - Boron, fltd, ICP-OES - |
| Percent Relative Standard Deviation |
| Lab: NWQL, PCode: 01020, MCode: PLA13 |
| Dates: 10/09/04 through 04/03/25 |
| Open Data Set |
| - Boron, unfltd, ICP-MS, recov - |
| Percent Relative Standard Deviation |
| Lab: NWQL, PCode: 01022, MCode: PLM47 |
| Dates: 10/26/05 through 04/30/15 |
| Open Data Set |
| - Boron, unfltd, ICP-MS, recov - |
| Percent Relative Standard Deviation |
| Lab: NWQL, PCode: 01022, MCode: PLM78 |
| Dates: 05/12/15 through 04/04/25 |
| Open Data Set |
| - Boron, unfltd, ICP-OES, recov - |
| Percent Relative Standard Deviation |
| Lab: NWQL, PCode: 01022, MCode: PLA15 |
| Dates: 11/02/12 through 02/10/14 |
| Open Data Set |
| - Cadmium, UNF, GFAA - |
| Percent Relative Standard Deviation |
| Lab: NWQL, PCode: 01027, MCode: GF097 |
| Dates: 10/20/04 through 08/18/05 |
| Open Data Set |

| - Cadmium, fltd, ICP-MS - |
| Percent Relative Standard Deviation |
| Lab: NWQL, PCode: 01025, MCode: PLM43 |
| Dates: 10/13/04 through 04/09/25 |
| Open Data Set |
| - Cadmium, fltd, ICP-OES - |
| Percent Relative Standard Deviation |
| Lab: NWQL, PCode: 01025, MCode: PLA11 |
| Dates: 03/03/05 through 08/01/05 |
| Open Data Set |

| - Cadmium, unfltd, ICP-MS, recov - |
| Percent Relative Standard Deviation |
| Lab: NWQL, PCode: 01027, MCode: PLM47 |
| Dates: 11/01/04 through 04/30/15 |
| Open Data Set |
| - Cadmium, unfltd, ICP-MS, recov - |
| Percent Relative Standard Deviation |
| Lab: NWQL, PCode: 01027, MCode: PLM78 |
| Dates: 05/12/15 through 03/31/25 |
| Open Data Set |
| - Chromium, FIL, GFAA - |
| Percent Relative Standard Deviation |
| Lab: NWQL, PCode: 01030, MCode: GF075 |
| Dates: 10/08/04 through 09/07/05 |
| Open Data Set |
| - Chromium, UNF, GFAA - |
| Percent Relative Standard Deviation |
| Lab: NWQL, PCode: 01034, MCode: GF094 |
| Dates: 10/21/04 through 09/01/05 |
| Open Data Set |
| - Chromium, fltd, ICP-OES - |
| Percent Relative Standard Deviation |
| Lab: NWQL, PCode: 01030, MCode: PLA11 |
| Dates: 10/09/04 through 07/08/14 |
| Open Data Set |
| - Chromium, fltd, cICP-MS - |
| Percent Relative Standard Deviation |
| Lab: NWQL, PCode: 01030, MCode: PLM10 |
| Dates: 09/16/05 through 04/09/25 |
| Open Data Set |
| - Chromium, unfltd, ICP-OES, recov - |
| Percent Relative Standard Deviation |
| Lab: NWQL, PCode: 01034, MCode: PLA15 |
| Dates: 11/02/07 through 07/29/14 |
| Open Data Set |
| - Chromium, unfltd, ICP-OES, recov - |
| Percent Relative Standard Deviation |
| Lab: NWQL, PCode: 01034, MCode: PLO07 |
| Dates: 11/06/19 through 04/03/25 |
| Open Data Set |

| - Chromium, unfltd, cICP-MS, recov - |
| Percent Relative Standard Deviation |
| Lab: NWQL, PCode: 01034, MCode: PLM11 |
| Dates: 09/30/05 through 04/22/15 |
| Open Data Set |
| - Chromium, unfltd, cICP-MS, recov - |
| Percent Relative Standard Deviation |
| Lab: NWQL, PCode: 01034, MCode: PLM77 |
| Dates: 05/12/15 through 03/31/25 |
| Open Data Set |
| - Cobalt, fltd, ICP-MS - |
| Percent Relative Standard Deviation |
| Lab: NWQL, PCode: 01035, MCode: PLM43 |
| Dates: 10/13/04 through 07/19/06 |
| Open Data Set |
| - Cobalt, fltd, ICP-OES - |
| Percent Relative Standard Deviation |
| Lab: NWQL, PCode: 01035, MCode: PLA11 |
| Dates: 03/03/05 through 08/25/05 |
| Open Data Set |
| - Cobalt, fltd, cICP-MS - |
| Percent Relative Standard Deviation |
| Lab: NWQL, PCode: 01035, MCode: PLM10 |
| Dates: 11/15/05 through 04/09/25 |
| Open Data Set |
| - Cobalt, unfltd, ICP-MS, recov - |
| Percent Relative Standard Deviation |
| Lab: NWQL, PCode: 01037, MCode: PLM48 |
| Dates: 02/01/06 through 04/23/07 |
| Open Data Set |

| - Cobalt, unfltd, cICP-MS, recov - |
| Percent Relative Standard Deviation |
| Lab: NWQL, PCode: 01037, MCode: PLM11 |
| Dates: 12/30/05 through 04/30/15 |
| Open Data Set |
| - Cobalt, unfltd, cICP-MS, recov - |
| Percent Relative Standard Deviation |
| Lab: NWQL, PCode: 01037, MCode: PLM77 |
| Dates: 05/12/15 through 03/31/25 |
| Open Data Set |
| - Copper, UNF, GFAA - |
| Percent Relative Standard Deviation |
| Lab: NWQL, PCode: 01042, MCode: GF099 |
| Dates: 10/20/04 through 06/17/05 |
| Open Data Set |
| - Copper, fltd, ICP-MS - |
| Percent Relative Standard Deviation |
| Lab: NWQL, PCode: 01040, MCode: PLM43 |
| Dates: 10/13/04 through 07/19/06 |
| Open Data Set |
| - Copper, fltd, ICP-OES - |
| Percent Relative Standard Deviation |
| Lab: NWQL, PCode: 01040, MCode: PLA11 |
| Dates: 11/05/04 through 09/29/05 |
| Open Data Set |

| - Copper, fltd, cICP-MS - |
| Percent Relative Standard Deviation |
| Lab: NWQL, PCode: 01040, MCode: PLM10 |
| Dates: 11/22/05 through 04/09/25 |
| Open Data Set |
| - Copper, unfltd, ICP-MS, recov - |
| Percent Relative Standard Deviation |
| Lab: NWQL, PCode: 01042, MCode: PLM48 |
| Dates: 11/01/04 through 04/23/07 |
| Open Data Set |

| - Copper, unfltd, cICP-MS, recov - |
| Percent Relative Standard Deviation |
| Lab: NWQL, PCode: 01042, MCode: PLM11 |
| Dates: 12/30/05 through 07/26/16 |
| Open Data Set |
| - Copper, unfltd, cICP-MS, recov - |
| Percent Relative Standard Deviation |
| Lab: NWQL, PCode: 01042, MCode: PLM77 |
| Dates: 05/12/15 through 03/31/25 |
| Open Data Set |
| - Dimethylarsinate (DMA), IC-ICP-MS - |
| Percent Relative Standard Deviation |
| Lab: NWQL, PCode: 62455, MCode: PLM35 |
| Dates: 11/16/04 through 10/12/07 |
| Open Data Set |

| - Iron, fltd, ICP-OES - |
| Percent Relative Standard Deviation |
| Lab: NWQL, PCode: 01046, MCode: PLA11 |
| Dates: 10/09/04 through 04/18/25 |
| Open Data Set |
| - Iron, unfltd, ICP-OES, recov - |
| Percent Relative Standard Deviation |
| Lab: NWQL, PCode: 01045, MCode: PLA15 |
| Dates: 10/20/04 through 03/24/15 |
| Open Data Set |
| - Iron, unfltd, ICP-OES, recov - |
| Percent Relative Standard Deviation |
| Lab: NWQL, PCode: 01045, MCode: PLO07 |
| Dates: 05/28/15 through 04/03/25 |
| Open Data Set |
| - Lead, UNF, GFAA - |
| Percent Relative Standard Deviation |
| Lab: NWQL, PCode: 01051, MCode: GF100 |
| Dates: 10/20/04 through 08/18/05 |
| Open Data Set |

| - Lead, fltd, ICP-MS - |
| Percent Relative Standard Deviation |
| Lab: NWQL, PCode: 01049, MCode: PLM43 |
| Dates: 10/13/04 through 04/09/25 |
| Open Data Set |
| - Lead, unfltd, ICP-MS, recov - |
| Percent Relative Standard Deviation |
| Lab: NWQL, PCode: 01051, MCode: PLM48 |
| Dates: 11/01/04 through 04/30/15 |
| Open Data Set |
| - Lead, unfltd, ICP-MS, recov - |
| Percent Relative Standard Deviation |
| Lab: NWQL, PCode: 01051, MCode: PLM78 |
| Dates: 05/12/15 through 03/31/25 |
| Open Data Set |
| - Lithium, fltd, ICP-MS - |
| Percent Relative Standard Deviation |
| Lab: NWQL, PCode: 01130, MCode: PLM40 |
| Dates: 10/27/04 through 04/09/25 |
| Open Data Set |
| - Lithium, fltd, ICP-OES - |
| Percent Relative Standard Deviation |
| Lab: NWQL, PCode: 01130, MCode: PLA11 |
| Dates: 10/09/04 through 08/06/16 |
| Open Data Set |
| - Lithium, unfltd, ICP-MS, recov - |
| Percent Relative Standard Deviation |
| Lab: NWQL, PCode: 01132, MCode: PLM48 |
| Dates: 10/04/12 through 04/30/15 |
| Open Data Set |
| - Lithium, unfltd, ICP-MS, recov - |
| Percent Relative Standard Deviation |
| Lab: NWQL, PCode: 01132, MCode: PLM78 |
| Dates: 05/12/15 through 04/10/25 |
| Open Data Set |
| - Manganese, fltd, ICP-MS - |
| Percent Relative Standard Deviation |
| Lab: NWQL, PCode: 01056, MCode: PLM43 |
| Dates: 10/13/04 through 04/09/25 |
| Open Data Set |
| - Manganese, fltd, ICP-OES - |
| Percent Relative Standard Deviation |
| Lab: NWQL, PCode: 01056, MCode: PLA11 |
| Dates: 10/09/04 through 04/18/25 |
| Open Data Set |
| - Manganese, unfltd, ICP-MS, recov - |
| Percent Relative Standard Deviation |
| Lab: NWQL, PCode: 01055, MCode: PLM48 |
| Dates: 11/01/04 through 04/30/15 |
| Open Data Set |
| - Manganese, unfltd, ICP-MS, recov - |
| Percent Relative Standard Deviation |
| Lab: NWQL, PCode: 01055, MCode: PLM78 |
| Dates: 05/12/15 through 03/31/25 |
| Open Data Set |
| - Manganese, unfltd, ICP-OES, recov - |
| Percent Relative Standard Deviation |
| Lab: NWQL, PCode: 01055, MCode: PLA15 |
| Dates: 10/20/04 through 03/27/15 |
| Open Data Set |
| - Manganese, unfltd, ICP-OES, recov - |
| Percent Relative Standard Deviation |
| Lab: NWQL, PCode: 01055, MCode: PLO07 |
| Dates: 05/28/15 through 04/03/25 |
| Open Data Set |
| - Mercury, fltd, CVAF - |
| Percent Relative Standard Deviation |
| Lab: NWQL, PCode: 71890, MCode: CV014 |
| Dates: 10/14/04 through 03/06/25 |
| Open Data Set |
| - Mercury, unfltd, CVAF - |
| Percent Relative Standard Deviation |
| Lab: NWQL, PCode: 71900, MCode: CV018 |
| Dates: 10/19/04 through 03/17/25 |
| Open Data Set |
| - Molybdenum, fltd, ICP-MS - |
| Percent Relative Standard Deviation |
| Lab: NWQL, PCode: 01060, MCode: PLM43 |
| Dates: 10/13/04 through 04/09/25 |
| Open Data Set |
| - Molybdenum, unfltd, ICP-MS, recov - |
| Percent Relative Standard Deviation |
| Lab: NWQL, PCode: 01062, MCode: PLM48 |
| Dates: 10/26/05 through 04/30/15 |
| Open Data Set |
| - Molybdenum, unfltd, ICP-MS, recov - |
| Percent Relative Standard Deviation |
| Lab: NWQL, PCode: 01062, MCode: PLM78 |
| Dates: 05/12/15 through 03/31/25 |
| Open Data Set |
| - Monomethylarsonate (MMA), IC-ICP-MS - |
| Percent Relative Standard Deviation |
| Lab: NWQL, PCode: 62454, MCode: PLM35 |
| Dates: 11/16/04 through 10/12/07 |
| Open Data Set |

| - Nickel, fltd, ICP-MS - |
| Percent Relative Standard Deviation |
| Lab: NWQL, PCode: 01065, MCode: PLM43 |
| Dates: 10/13/04 through 07/19/06 |
| Open Data Set |

| - Nickel, fltd, ICP-OES - |
| Percent Relative Standard Deviation |
| Lab: NWQL, PCode: 01065, MCode: PLA11 |
| Dates: 03/03/05 through 08/30/05 |
| Open Data Set |

| - Nickel, fltd, cICP-MS - |
| Percent Relative Standard Deviation |
| Lab: NWQL, PCode: 01065, MCode: PLM10 |
| Dates: 11/15/05 through 04/09/25 |
| Open Data Set |
| - Nickel, unfltd, ICP-MS, recov - |
| Percent Relative Standard Deviation |
| Lab: NWQL, PCode: 01067, MCode: PLM48 |
| Dates: 11/01/04 through 04/23/07 |
| Open Data Set |

| - Nickel, unfltd, cICP-MS, recov - |
| Percent Relative Standard Deviation |
| Lab: NWQL, PCode: 01067, MCode: PLM11 |
| Dates: 12/30/05 through 04/30/15 |
| Open Data Set |
| - Nickel, unfltd, cICP-MS, recov - |
| Percent Relative Standard Deviation |
| Lab: NWQL, PCode: 01067, MCode: PLM77 |
| Dates: 05/12/15 through 03/31/25 |
| Open Data Set |
| - Selenium, FIL, GFAA - |
| Percent Relative Standard Deviation |
| Lab: NWQL, PCode: 01145, MCode: GF091 |
| Dates: 12/02/04 through 08/24/05 |
| Open Data Set |
| - Selenium, UNF, GFAA - |
| Percent Relative Standard Deviation |
| Lab: NWQL, PCode: 01147, MCode: GF102 |
| Dates: 10/14/04 through 08/17/05 |
| Open Data Set |
| - Selenium, fltd, ICP-MS - |
| Percent Relative Standard Deviation |
| Lab: NWQL, PCode: 01145, MCode: PLM40 |
| Dates: 10/13/04 through 10/06/05 |
| Open Data Set |
| - Selenium, fltd, cICP-MS - |
| Percent Relative Standard Deviation |
| Lab: NWQL, PCode: 01145, MCode: PLM10 |
| Dates: 09/09/05 through 04/09/25 |
| Open Data Set |
| - Selenium, unfltd, ICP-MS, recov - |
| Percent Relative Standard Deviation |
| Lab: NWQL, PCode: 01147, MCode: PL120 |
| Dates: 11/01/04 through 10/06/05 |
| Open Data Set |

| - Selenium, unfltd, cICP-MS, recov - |
| Percent Relative Standard Deviation |
| Lab: NWQL, PCode: 01147, MCode: PLM11 |
| Dates: 09/20/05 through 04/30/15 |
| Open Data Set |
| - Selenium, unfltd, cICP-MS, recov - |
| Percent Relative Standard Deviation |
| Lab: NWQL, PCode: 01147, MCode: PLM77 |
| Dates: 05/12/15 through 03/31/25 |
| Open Data Set |
| - Silver, fltd, ICP-MS - |
| Percent Relative Standard Deviation |
| Lab: NWQL, PCode: 01075, MCode: PLM43 |
| Dates: 10/13/04 through 04/09/25 |
| Open Data Set |
| - Silver, unfltd, ICP-MS, recov - |
| Percent Relative Standard Deviation |
| Lab: NWQL, PCode: 01077, MCode: PLM48 |
| Dates: 11/01/04 through 04/30/15 |
| Open Data Set |
| - Silver, unfltd, ICP-MS, recov - |
| Percent Relative Standard Deviation |
| Lab: NWQL, PCode: 01077, MCode: PLM78 |
| Dates: 05/12/15 through 03/31/25 |
| Open Data Set |
| - Strontium, fltd, ICP-MS - |
| Percent Relative Standard Deviation |
| Lab: NWQL, PCode: 01080, MCode: PLM40 |
| Dates: 10/13/04 through 04/09/25 |
| Open Data Set |
| - Strontium, fltd, ICP-OES - |
| Percent Relative Standard Deviation |
| Lab: NWQL, PCode: 01080, MCode: PLA11 |
| Dates: 10/09/04 through 04/03/25 |
| Open Data Set |
| - Strontium, unfltd, ICP-MS, recov - |
| Percent Relative Standard Deviation |
| Lab: NWQL, PCode: 01082, MCode: PLM48 |
| Dates: 10/04/12 through 04/30/15 |
| Open Data Set |
| - Strontium, unfltd, ICP-MS, recov - |
| Percent Relative Standard Deviation |
| Lab: NWQL, PCode: 01082, MCode: PLM78 |
| Dates: 05/12/15 through 03/31/25 |
| Open Data Set |
| - Thallium, fltd, ICP-MS - |
| Percent Relative Standard Deviation |
| Lab: NWQL, PCode: 01057, MCode: PLM40 |
| Dates: 10/27/04 through 04/04/25 |
| Open Data Set |
| - Thallium, unfltd, ICP-MS, recov - |
| Percent Relative Standard Deviation |
| Lab: NWQL, PCode: 01059, MCode: PLM48 |
| Dates: 11/15/07 through 10/08/14 |
| Open Data Set |
| - Thallium, unfltd, ICP-MS, recov - |
| Percent Relative Standard Deviation |
| Lab: NWQL, PCode: 01059, MCode: PLM78 |
| Dates: 10/26/23 through 03/31/25 |
| Open Data Set |

| - Tungsten, fltd, cICP-MS - |
| Percent Relative Standard Deviation |
| Lab: NWQL, PCode: 01155, MCode: PLM10 |
| Dates: 10/12/07 through 10/10/12 |
| Open Data Set |
| - Uranium, fltd, ICP-MS - |
| Percent Relative Standard Deviation |
| Lab: NWQL, PCode: 22703, MCode: PLM43 |
| Dates: 10/13/04 through 04/09/25 |
| Open Data Set |
| - Uranium, unfltd, ICP-MS, recov - |
| Percent Relative Standard Deviation |
| Lab: NWQL, PCode: 28011, MCode: PLM48 |
| Dates: 11/15/07 through 04/22/15 |
| Open Data Set |
| - Uranium, unfltd, ICP-MS, recov - |
| Percent Relative Standard Deviation |
| Lab: NWQL, PCode: 28011, MCode: PLM78 |
| Dates: 05/12/15 through 04/10/25 |
| Open Data Set |
| - Vanadium, fltd, ICP-MS - |
| Percent Relative Standard Deviation |
| Lab: NWQL, PCode: 01085, MCode: PLM40 |
| Dates: 10/13/04 through 10/06/05 |
| Open Data Set |
| - Vanadium, fltd, ICP-OES - |
| Percent Relative Standard Deviation |
| Lab: NWQL, PCode: 01085, MCode: PLA11 |
| Dates: 10/09/04 through 11/20/06 |
| Open Data Set |
| - Vanadium, fltd, cICP-MS - |
| Percent Relative Standard Deviation |
| Lab: NWQL, PCode: 01085, MCode: PLM10 |
| Dates: 11/15/05 through 04/09/25 |
| Open Data Set |
| - Vanadium, unfltd, ICP-OES, recov - |
| Percent Relative Standard Deviation |
| Lab: NWQL, PCode: 01087, MCode: PLA15 |
| Dates: 11/21/08 through 11/12/09 |
| Open Data Set |

| - Vanadium, unfltd, cICP-MS, recov - |
| Percent Relative Standard Deviation |
| Lab: NWQL, PCode: 01087, MCode: PLM11 |
| Dates: 10/04/12 through 11/26/13 |
| Open Data Set |

| - Vanadium, unfltd, cICP-MS, recov - |
| Percent Relative Standard Deviation |
| Lab: NWQL, PCode: 01087, MCode: PLM77 |
| Dates: 10/26/23 through 03/31/25 |
| Open Data Set |

| - Zinc, fltd, ICP-MS - |
| Percent Relative Standard Deviation |
| Lab: NWQL, PCode: 01090, MCode: PLM43 |
| Dates: 10/13/04 through 07/19/06 |
| Open Data Set |
| - Zinc, fltd, ICP-OES - |
| Percent Relative Standard Deviation |
| Lab: NWQL, PCode: 01090, MCode: PLA11 |
| Dates: 10/09/04 through 04/03/25 |
| Open Data Set |
| - Zinc, fltd, cICP-MS - |
| Percent Relative Standard Deviation |
| Lab: NWQL, PCode: 01090, MCode: PLM10 |
| Dates: 11/15/05 through 04/09/25 |
| Open Data Set |
| - Zinc, unfltd, ICP-MS, recov - |
| Percent Relative Standard Deviation |
| Lab: NWQL, PCode: 01092, MCode: PLM48 |
| Dates: 11/01/04 through 04/23/07 |
| Open Data Set |

| - Zinc, unfltd, ICP-OES, recov - |
| Percent Relative Standard Deviation |
| Lab: NWQL, PCode: 01092, MCode: PLA15 |
| Dates: 10/20/04 through 03/24/15 |
| Open Data Set |
| - Zinc, unfltd, ICP-OES, recov - |
| Percent Relative Standard Deviation |
| Lab: NWQL, PCode: 01092, MCode: PLO07 |
| Dates: 05/28/15 through 04/03/25 |
| Open Data Set |
| - Zinc, unfltd, cICP-MS, recov - |
| Percent Relative Standard Deviation |
| Lab: NWQL, PCode: 01092, MCode: PLM11 |
| Dates: 01/20/07 through 04/30/15 |
| Open Data Set |
| - Zinc, unfltd, cICP-MS, recov - |
| Percent Relative Standard Deviation |
| Lab: NWQL, PCode: 01092, MCode: PLM77 |
| Dates: 05/12/15 through 04/04/25 |
| Open Data Set |